
Per Wikipedia, a business dashboard is “an easy to read, often single page, real-time user interface, showing a graphical presentation of the current status (snapshot) and historical trends of an organization’s Key Performance Indicators (KPIs) to enable instantaneous and informed decisions to be made at a glance.”

Whenever I talk to an audience about business dashboards, I always start out with this mouth full of an explanation. Because thats what dashboards do… they take a lot of complicated data and break it down into a few powerful visuals that provide insightful and actionable intelligence. Actionable being the key term.
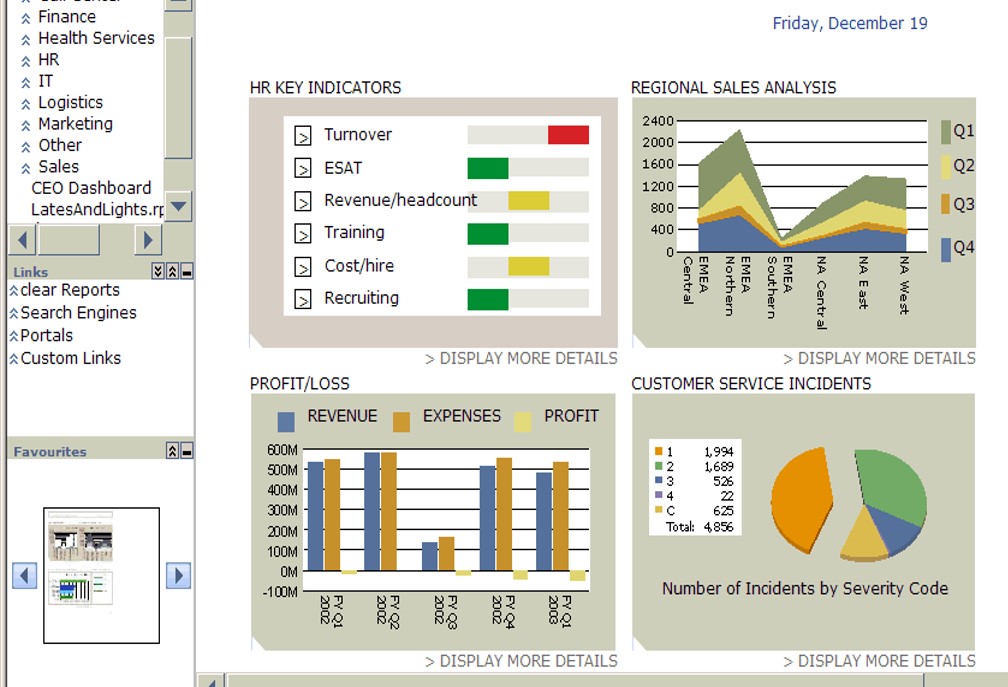
My favorite dashboard builder is Tableau, and I instruct all my trainees to use Tableau Public (it’s free) to get some hands on experience in building dashboards. Qlikview is also pretty cool at building user friendly boards. There are several others that have free or trial versions. Gartner does and annual review of BI tools with a special focus on the ones who best provide an easy to use dashboard builder. Below is a sample dashboard.
“Numbers have an important story to tell. They rely on you to give them a clear and convincing voice. ” – Stephen Few, the grandfather of Business Dashboards.
