

How Things Have Changed Since I Started
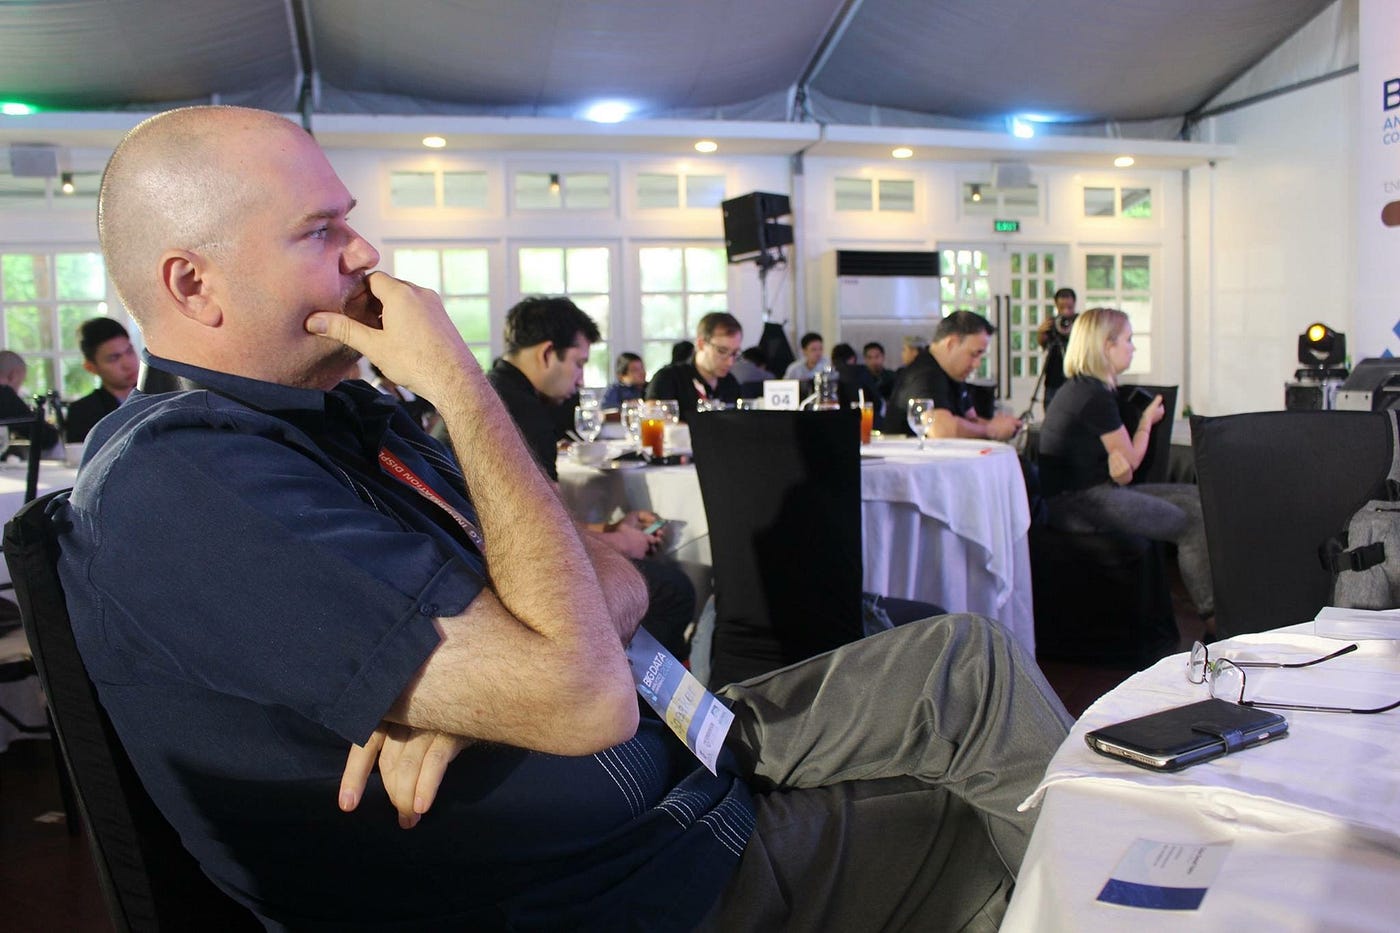
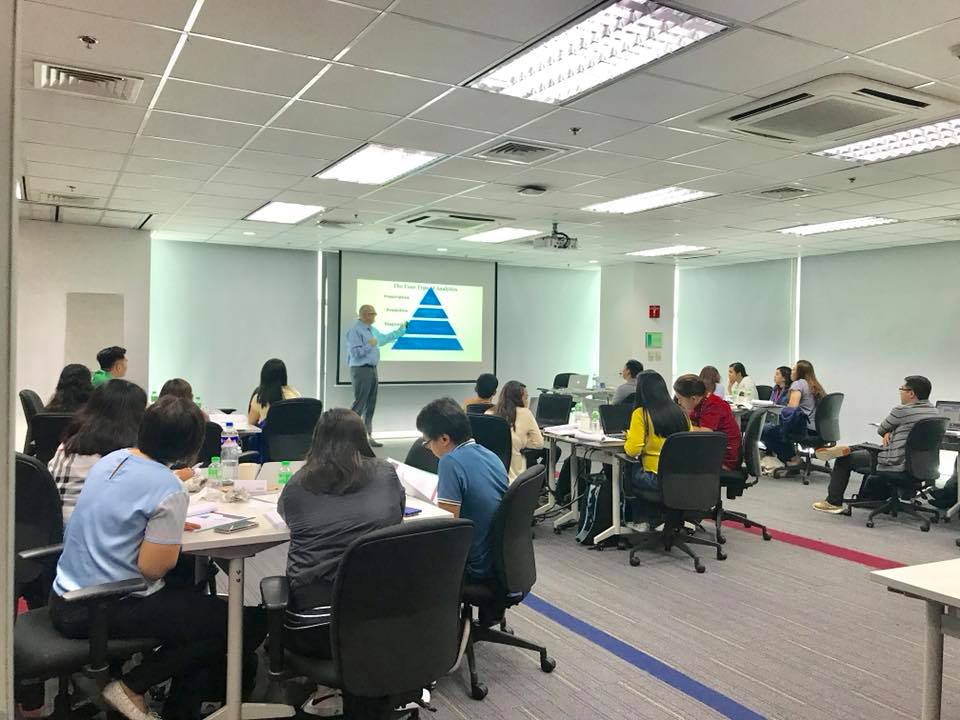
I recently conducted a week long analytics training with a key business partner and I was amazed by how far we have come. When I conducted my very first analytics training for 4 people back in April of 2012 I had no idea I’d still be doing it 12+ years later.
Back then I half expected to be busy for awhile, but eventually analytics would be so wide spread and so accessible that I would have happily worked myself out of a job at some point.
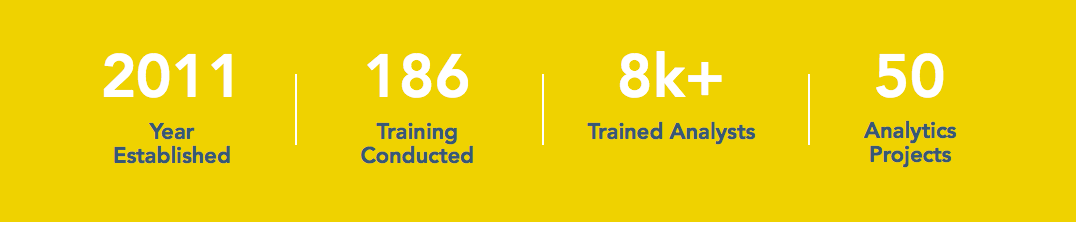
So I am still kinda surprised that has happened. I’ve conducted some close to 100 trainings, for dozens of schools, hundreds of companies and literally over 10,000 Filipinos since 2012 and at the moment it seems like that was just a drop in the bucket.
As I told the team, I had a few learnings from the past two weeks I wanted to share before we try any more face to face data analytics trainings. I broke down my feedback into the following areas:
· Marketing
· Communication
· Class Size and Time
· Class Requirements
Marketing — It has been my experience that “selling” analytics training is something that most VAs and the population in general are either unaware of or intimidated by the topic. When we have successfully marketed the training in the past, we have focused mostly on LinkedIn to search and invite people looking to upskill and ones who have at least a little experience with the subject. There is a definitely a need for analytics training for freelancers, but I think really making a point that it hands on and that they will walk away with a lot of easy to implement strategies is key. Here are my suggestions for marketing on Facebook and LinkedIn:
Facebook: Use engaging visuals and testimonials from previous trainees, emphasizing the unique benefits and career advancement opportunities your data training provides for Filipino freelance VAs.
LinkedIn: Highlight the competitive edge your training offers in securing high-value international clients, coupled with specific examples of how these skills can lead to successful freelance projects.
Communication — In the case of traveling trainers like myself, there can usually be some improvements in pre-event communication between the trainer (me), the TC POC (training center point of contact) and the main marketing and operations team. I’m pretty adept at getting around the Philippines on my own, but it would be helpful to have more lead time on go/no-go so I can make the appropriate travel adjustments. The logistics of doing face to face trainings are never as easy as one might expect the be. Here are some tips based on my experience:
First, coordinate logistics early — ensure travel, accommodation, and training materials are confirmed and ready ahead of time. Second, maintain clear communication with the trainer, providing a single point of contact who can address any questions or issues promptly. Lastly, prepare the training environment by testing all equipment, setting up the room for optimal engagement, and having a support team on standby to assist with any technical or logistical needs during the event.
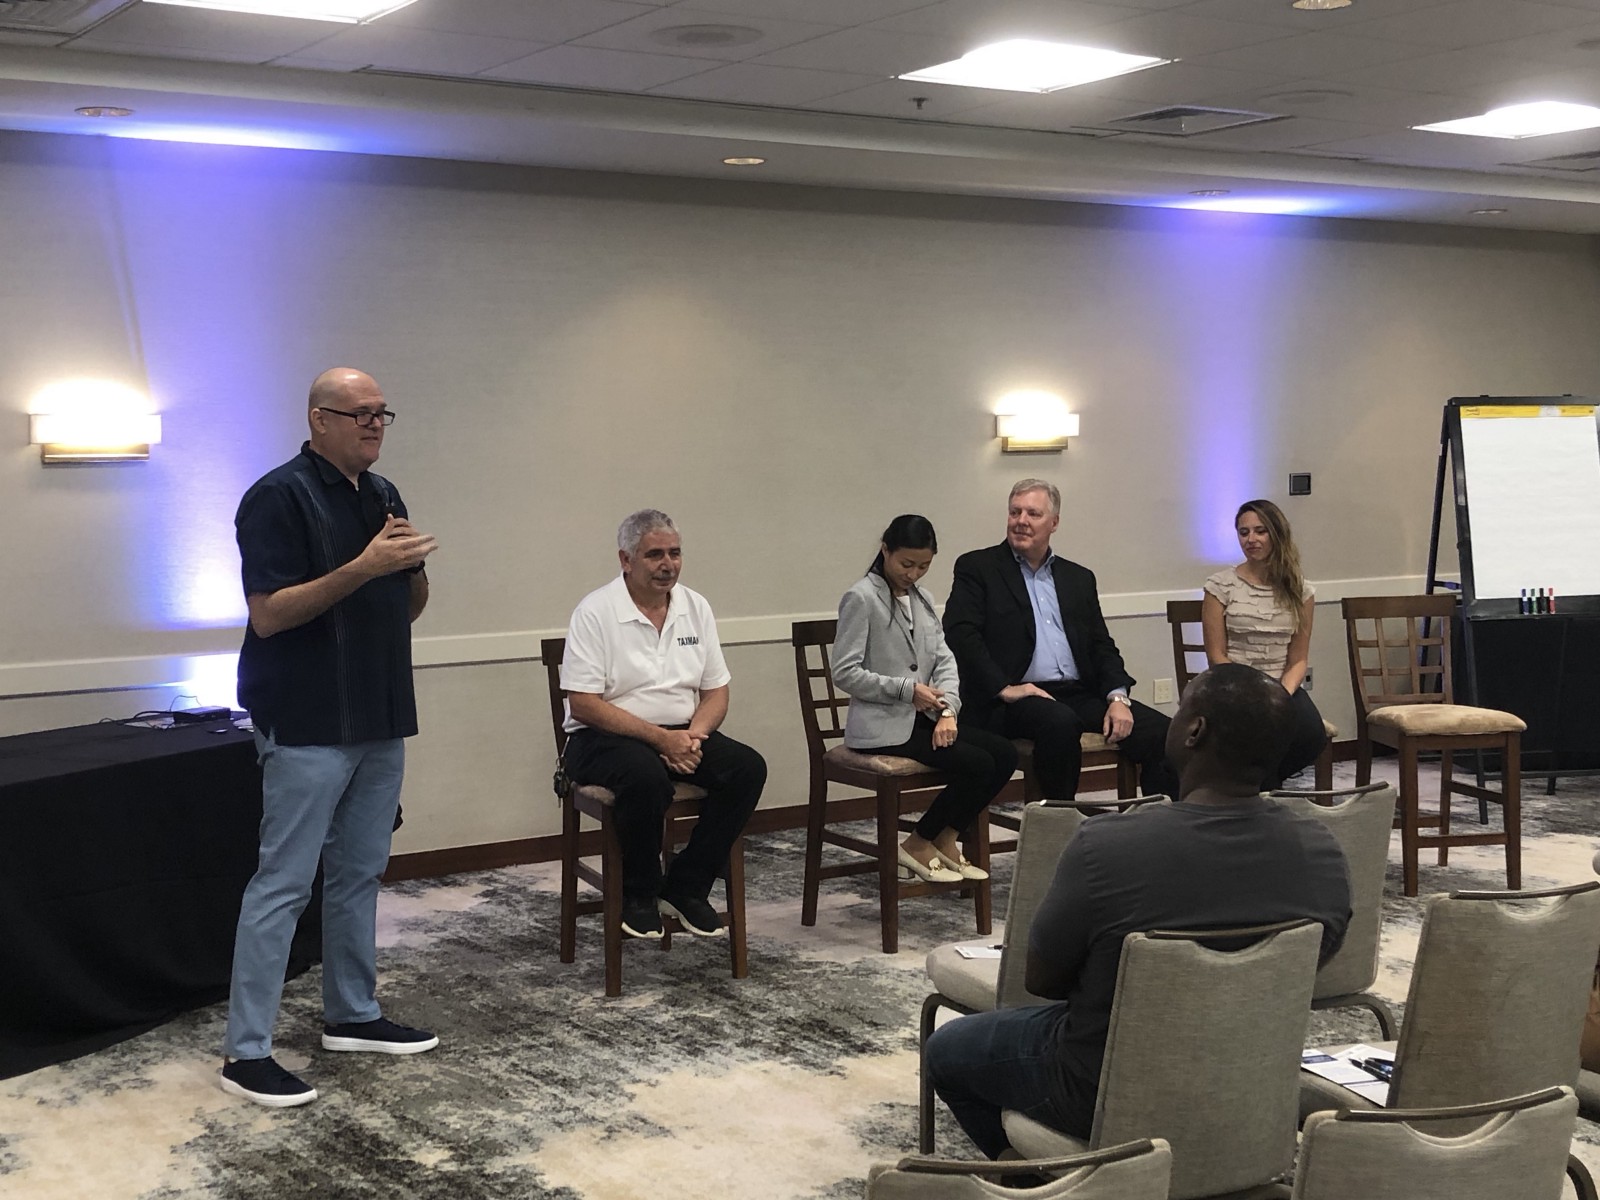
I have done trainings in just every place, room size, set up and level of tech imaginable, including in a high school gym with no AC on a super hot day and even at a bar once. You put me in front of a room with people and I can just go, but the better the communication, the better the end product will be.
Class Size and Time — I can train a room of any size. However, with less than 8–10 people the effectiveness of the training can suffer a little since the exercises are designed for 10–20 people. As I told the team recently, I think in the future, given a two business day window for final go/no-go… I’d suggest we postpone any training that doesn’t have at least 8 signed up beforehand. I realize this will likely mean some more cancellations as we evolve this training, but for now, to make it worthwhile to all, I think we should stick with that number.
As for time, historically the training takes about 16–20 hours so either a 2-day x 8 hour or a 5-day x 4 hour works. However, for me, I much prefer the 2 x 8 as it keep my schedule more flexible and minimizes travel costs. I can do 5 x 4 but would request no more than two back-to-back weeks of 5 x 4. We had originally planned four 5 x 4 in succession and that would have been too much for me. Hope that makes sense.
Thinking back, a class size of 10–20 is really optimal for face-to-face analytics training because it strikes the right balance between personalized attention and group interaction. With this size, trainers can provide individual support and feedback, ensuring that each participant grasps the concepts being taught. It also allows for meaningful group discussions and activities, where participants can learn from each other’s experiences. This size fosters a collaborative learning environment while maintaining the flexibility to adapt the training pace to the needs of the group, leading to more effective learning outcomes.
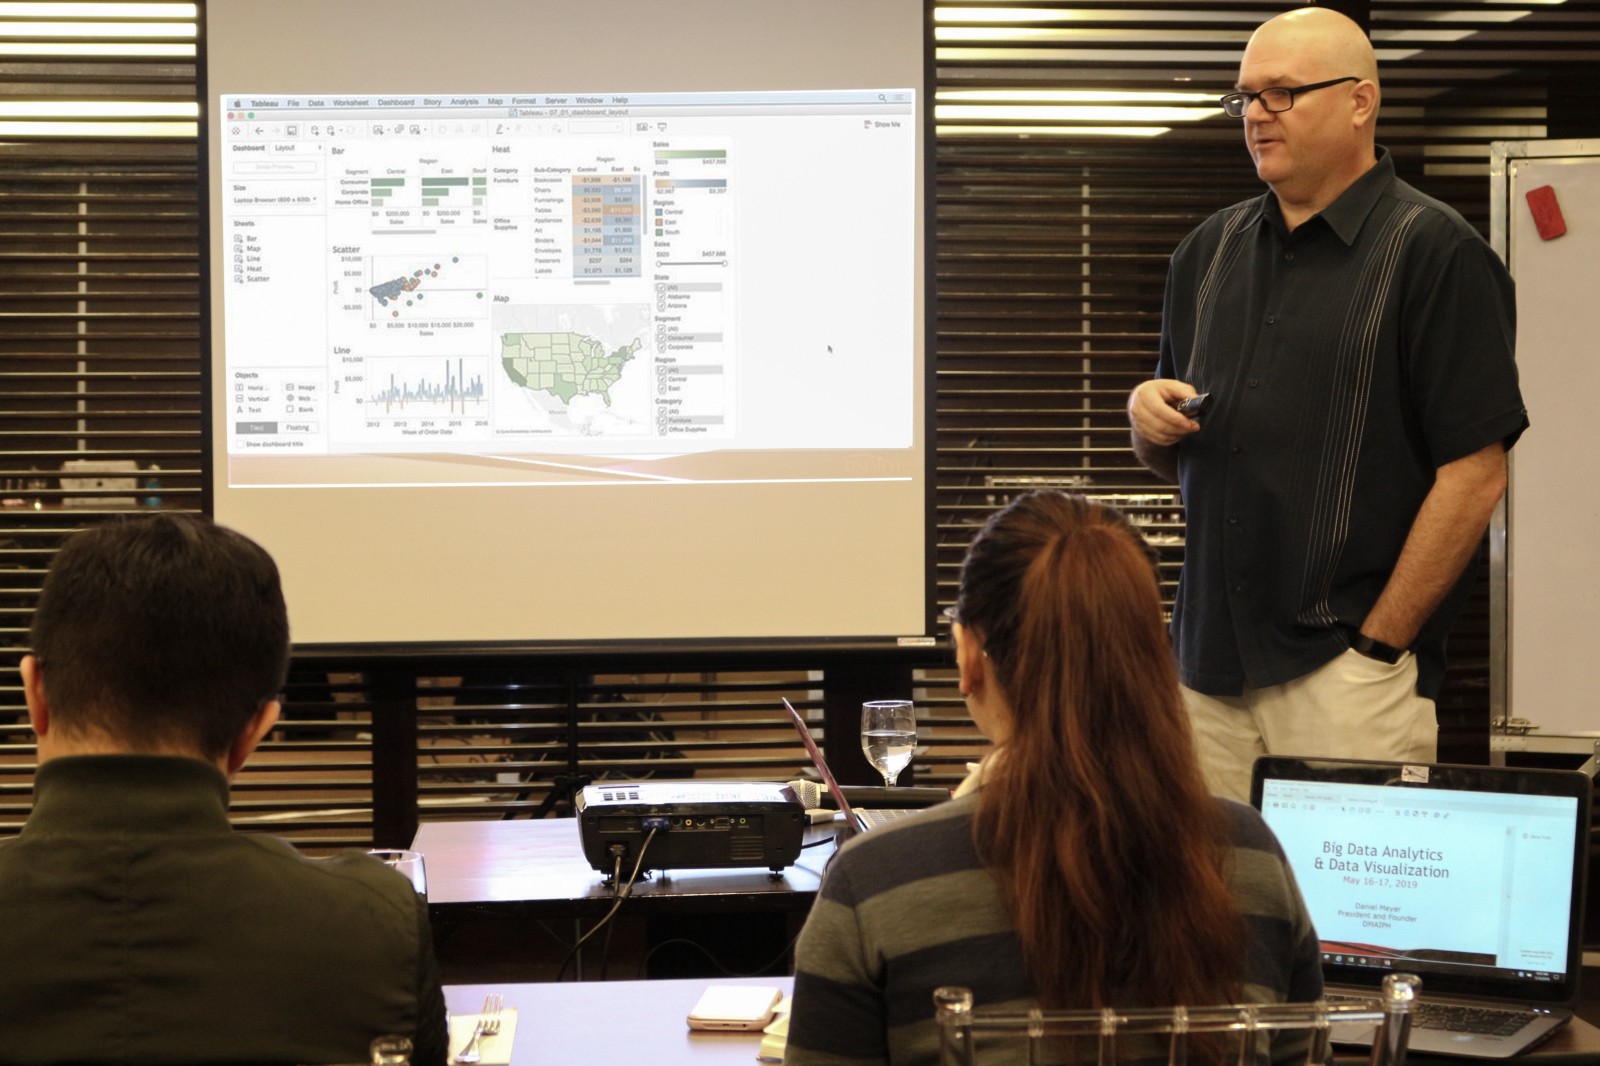
Class requirements — To be fully effective, trainees MUST have Microsoft Excel on the laptops they are using in class. If they are given access to the Surge laptops on site, then we need to have MS Excel installed on them. Using Google sheets limits some of the exercises and I had to forgo doing one of the key ones, building a predictive model because the limitations to the software.
MS Excel really is a must for this training because it offers advanced features and functionalities that are essential for in-depth data analysis, which Google Sheets lacks. Excel supports complex data modeling, extensive use of pivot tables, advanced charting options, and powerful add-ins like Power Query and Power Pivot, which are crucial for comprehensive analytics tasks. Additionally, Excel handles larger datasets more efficiently and integrates seamlessly with other Microsoft Office tools, making it the industry standard for professional data analysis. Google Sheets, while useful for basic tasks, falls short in handling complex, large-scale analytics required in this training.
If Excel can’t be installed locally, then the attendees have to bring a laptop with it installed and use their own. This really is a hard requirement that we can’t get around effectively.
In conclusion, I am pretty optimistic about doing more Face-to-Face Data Analytics trainings with my key business partners. I think as we all work to continue to evolve our approach we will see much more success if we follow this learnings. Regardless, I am and always will be a big fan of the your advocacy, simply love the training centers you are setting up across the country and absolutely adore working with the team. More power to us all as we strive to crunch the numbers on a national scale.
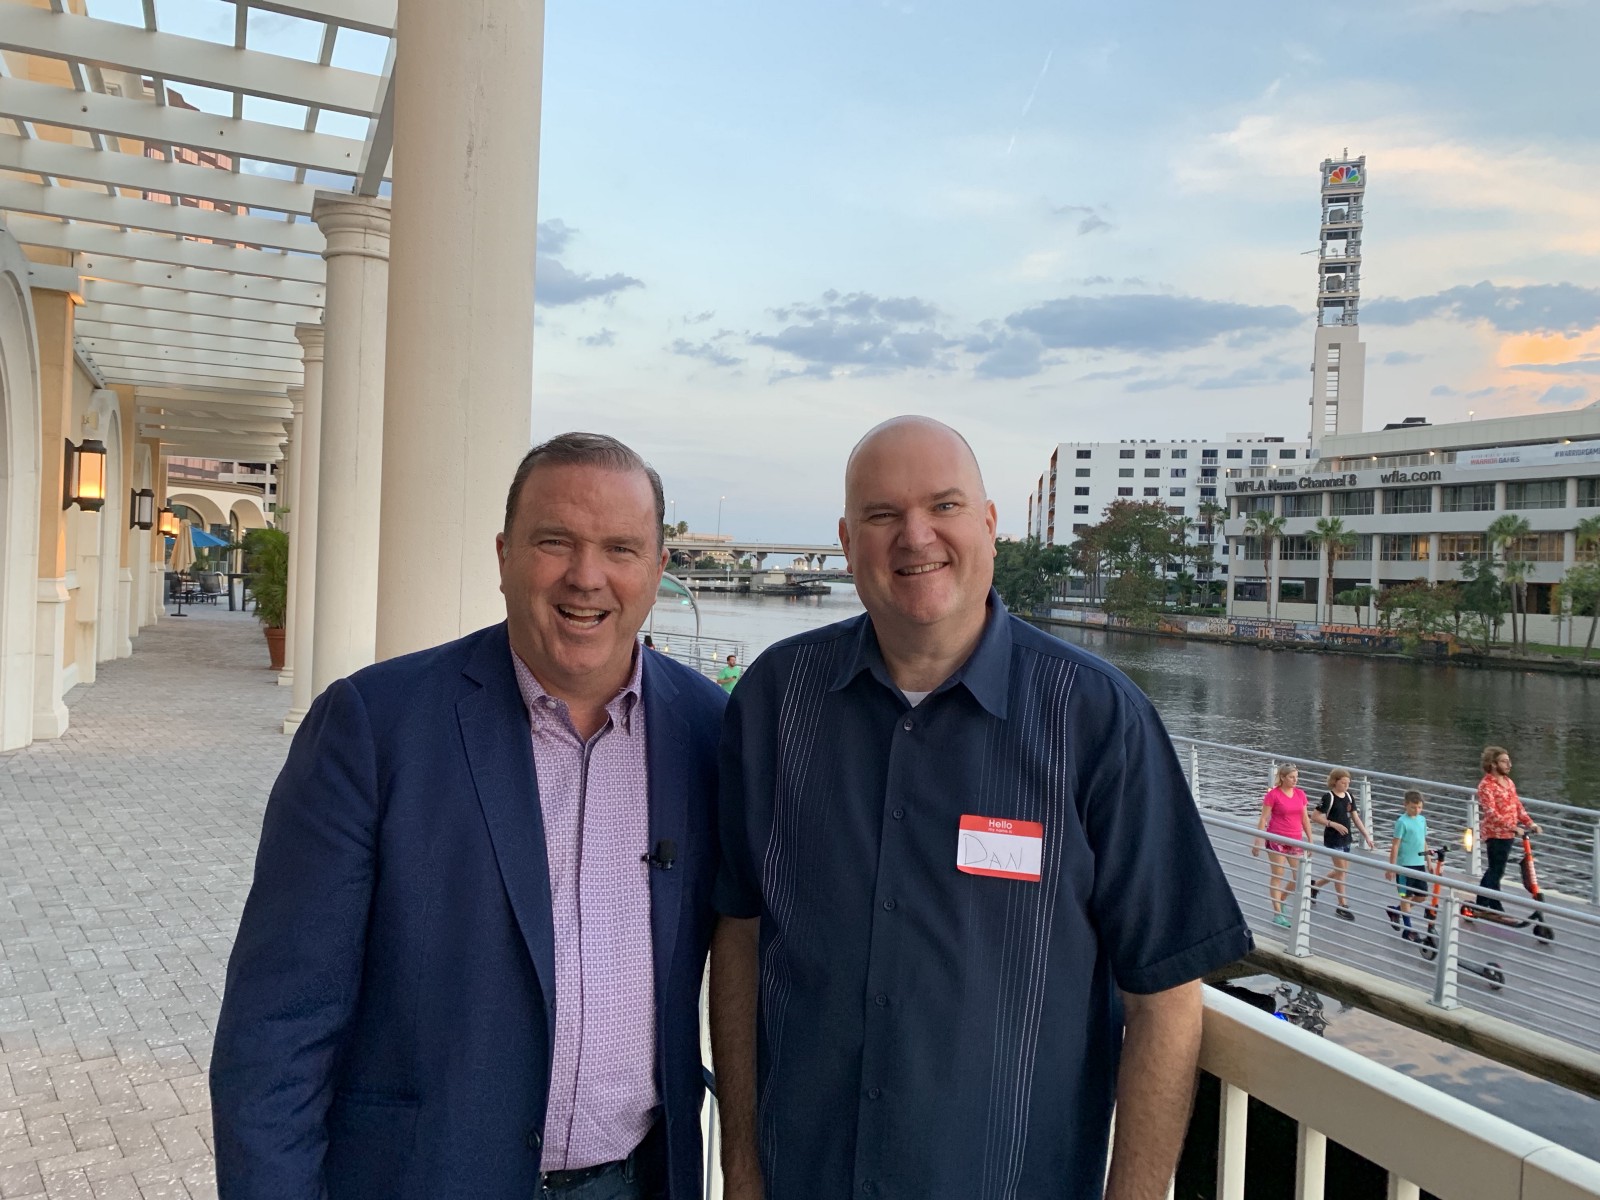
Sincerely,
Dan Meyer
Analytics Expert
So when I sent that, I thought back to where it all started so long ago… we have indeed come a long way. However, when I can still chat with a room full of educated, accomplished Filipino professionals and data analytics is still new to them… my work is so far from being complete.
MR. DAN MEYER is the President & Founder of DMAIPH, Decision-Making, Analytics & Intelligence — Philippines. DMAIPH is an analytics-centric consulting, outsourcing and training company with teams in the United States and the Philippines. We specialize in corporate analytics consulting, public analytics training and small and medium business analytics outsourcing.
One of the top analytics experts in the Philippines, Dan is also one of the most sought-after public speakers in the country and has personally trained over 10,000 Filipinos in various analytics functions. A gifted data storyteller and Tableau expert, Dan has consulted with over 300 companies and government entities in the Philippines.
Before setting up his own company, our founder worked as a Senior Analytics Consultant for Wells Fargo Bank for 15 years. Dan provided executive management analytics for the bank’s Remittance Service including developing business dashboards, overseeing competitive intelligence gathering, managing data analytics outsourcing projects and facilitating audit and risk management.
Dan earned a B.A. in History with a minor in International Studies from Sonoma State University and a M.A. in Education with a focus on Student Affairs in Higher Education from the Indiana University of Pennsylvania.
Dan recently published Putting Your Data to Work, an analytics guidebook designed to provide organizations with a solid foundation in using analytics to empower more data-driven decisions.


 And be the first one to learn and know what is in demand. We are here to supply you knowledge and provide you a strong foundation in analytics. We have the same curiosity when it comes to analytics? Trust me, I’m not a big fan of numbers, but I’m wrong, I never thought analytics also plays a role in giving us a perception through
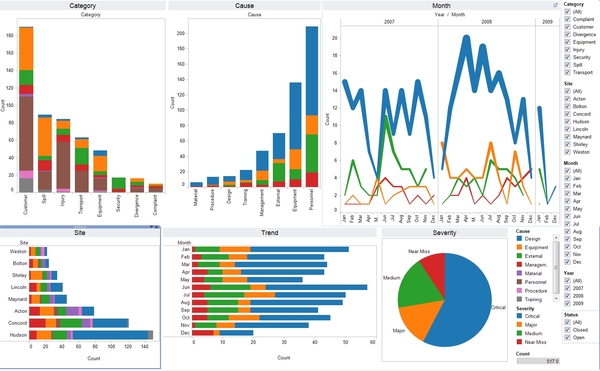


 Don’t worry, we are here to teach you the important fundamentals of data analytics step by step in a layman’s term.