

One of the keys to being successful with analytics is having a clear view of how all the data flows into and through your business.
Building a data map to show all the entry points, all the places where data is stored, who and how it is accessed and what filters might change your data is one of the things I can help you do.
This is step one towards data integration and is a great exercise for a half day in-house training/seminar for any business or organization that is struggling to get valued out of it’s big data.
Per Wikipedia… Data integration involves combining data residing in different sources and providing users with a unified view of these data. Data integration appears with increasing frequency as the volume and the need to share existing data explodes.
If you can imagine a map of your business in your mind you are half way there. The next step is to build a flow chart like the one below
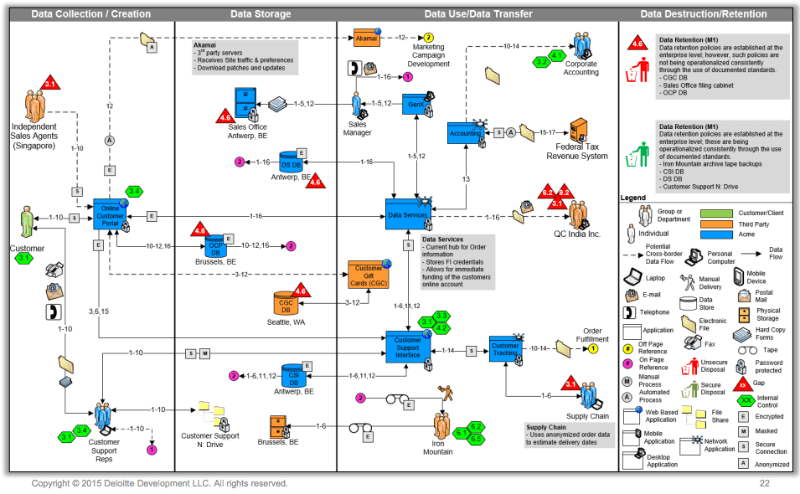
If you have something like this then you are on ahead of the game.
If you don’t, let us set up some time to discuss how to get started.
| Analytics Culture – The key to using analytics in a business is like a secret sauce. It is a unique combination of analytics talent, technology and technique that are brought together to enrich and empower an organization. A successful analytics culture is not easy to create, but DMAIPH can show you how. Contact DMAIPH now at analytics@dmaiph.com or connect with me directly so we can build a strategic plan to turn your company into analytics driven success story. |
