In recent years, the Philippines has seen a growing interest in data analytics, with organizations and companies investing in this field to improve their decision-making processes and gain a competitive edge. This trend is especially clear in the finance, healthcare, and e-commerce industries, where data analytics has become an essential tool for success.
The Philippine government has also recognized the importance of data analytics and has taken steps to promote its use. The Department of Science and Technology (DOST) and the Technical Education and Skills Development Authority (TESDA) have started to offer free online training courses for data analysts to fix the skills mismatch and shortage that has been seen in this field. This training is intended to cater to unemployed individuals, including high school graduates, and equip them with the necessary skills to enter the job market.
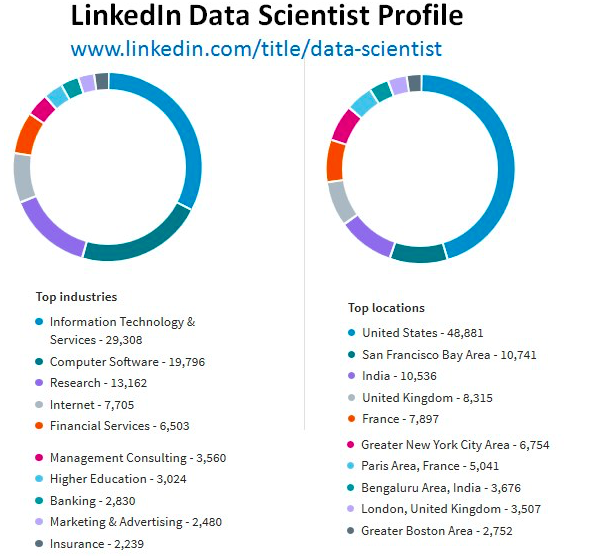
The Analytics Association of the Philippines estimates that by 2028, the country will need 500,000 analytics professionals. This need is not just in the IT field; data analysts are also needed in many other business fields. The entry-level salary for data analysts in the Philippines can go as high as P25,000 per month, making it an attractive career option for many.

To meet the demand for skilled professionals in this field, universities in the Philippines are starting to offer courses and degree programs in data analytics. The University of the Philippines Diliman has a Master of Science in Data Science program, while Ateneo de Manila University has a Bachelor of Science in Data Science program. This move by universities is important for making sure that the Philippines has enough skilled workers to meet the growing demand for data analysts.
It is also important for companies and organizations to talk to people in the industry to find out what skills are needed for jobs. As Sherwin Pelayo, executive director of the Analytics Association of the Philippines, said, “We talked to our industry members, and they said that if these skills were taught in senior high school, we would hire those who possess them.” The executive director of Philippine Business for Education, Justine Raagas, agreed with this point of view and stressed the need to talk to these sectors because they know what is needed in the workplace.
The Department of Trade and Industry has also emphasized the importance of knowing the skill sets needed by companies and training people based on these needs to ensure their employability after graduation. This approach ensures that individuals are equipped with the necessary skills that are in demand in the job market.
In conclusion, the Philippines is slowly but steadily embracing data analytics, and we can expect more changes and improvements in this field in the coming years. The government, universities, and private sector must continue to work together to make sure that the workforce has the skills it needs to meet the growing demand for data analysts. By doing so, the Philippines can position itself as a hub for data analytics in the region, and its workforce can contribute to the country’s economic growth and development.
Don’t miss out on more of Dan’s expert content. Follow his social media channels for exclusive tips, insights, and valuable information on data science and analytics.
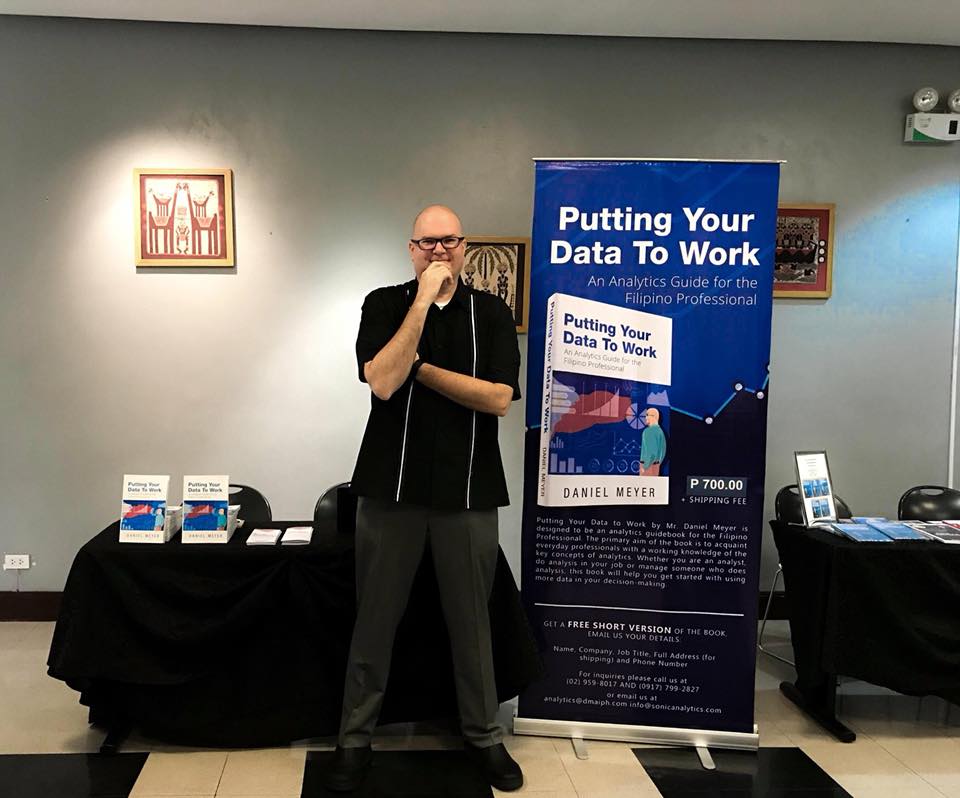
Daniel Meyer is the head of Sonic Analytics, an analytics firm that has been in the Big Data industry for over 20 years and has offices in Manila, the San Francisco Bay Area, and Ocala, Florida. He is an accomplished author, public speaker, and business expert specializing in virtual staffing and process automation.
Dan is known for providing big data analytics solutions, including business intelligence and data storytelling, to small businesses seeking to improve their use of data, virtual staffing, and technology. He strongly believes in using analytics for civic responsibility, and offers training, consulting, and education to promote this advocacy.
With his experience in training over 10,000 Filipinos, Dan is passionate about empowering the youth with valuable skills, such as graphic design, video editing, and data analytics. His objective is to equip them with the necessary abilities to harness the dynamic employment opportunities that lay ahead for millions of Filipinos.