Sir Conan Doyle’s famous fictional detective, Sherlock Holmes, couldn’t form any theories or draw any conclusions until he had sufficient data. Data is the basic building block of everything we do in analytics: the reports we build, the analysis we perform, the decisions we influence, and the optimizations we derive.

Several years ago I came across a book called the Accidental Analyst (*www.accidentalanalyst.com). The book opens with the questions, “Are you drowning in a sea of data? Would you like to take control of your data and analysis to quickly answer your business questions and make critical decisions? Do you want to confidentially present results and solutions to your managers, colleagues, clients and the public?”
Written by two Stanford professors, the book explores how and why people become good analysts and goes into detail about how to approach analytics successfully. After reading the book I was inspired to come up with a way to teach analytics to college students and fresh graduates.
The core of both the book and my program hinges on the ability of an analyst to find the right data at the right time. The authors suggested that identifying your data is where it all starts. Identifying exactly what you need to address whatever it is that you need to report.
Back at Wells Fargo, the single greatest attribute that I had that made me successful was my ability to size up how long it would take to deliver something. Knowing what data I would need, where I would find it and how long it would take to analyze it to come up with something useful made me somewhat of a wizard in the minds of the team.
Finding the right data at the right time requires one to first know ends and outs of their data. You have to know how the data is captured, where it is stored and how it makes its way to you. Knowing the data architecture in your business is the key.
So you have to get to know the people who know where your data comes from and how it gets there. Learn from them. Partner with them. Buy them doughnuts.
A couple of years ago I came across an analogy being used to describe data in a business. That of a data lake. A data lake is the living, breathing, evolving pool of all the data in a business. If you have a good data architecture, and you can navigate it fairly easily, then you have a data lake. Ideally, your business has data structured in such a way you can live off it. Data to a business is like water to living things… it sustains life
So once you have the lake mapped out, then you have to learn how to fish it. Knowing where the fish are biting is another key. Once you know what data you need, you have to know how to get to it quickly.
Business Intelligence tools help us here. As does coding languages to extract data from a database. These are your fishing tools. You have to practice using them to be good at getting the right data at the right time.
Another way to optimize your data search is to save your work. Of as I call it leave yourself breadcrumbs. Save the query. Cut and paste the code into a document and save it. Write down the steps. Whatever you need to do to replicate what you just did so you can do it again in the future without starting over from scratch.
So to recap, if you know data structure, you understand how data is stored and you leave yourself clues to do things faster next time.
Now the other part of the equation is knowing if the data you are using is the right data. Finding data quickly doesn’t do you any good if you bring back the wrong data.
So, how do you know if the data you are using is the right data to be using?
I can’t count the number of times I asked myself that question. In general, just about every new analysis or project or research or whatever it is you are using data for, you have to ask that question at some point.
Even data you have used a hundred times and comes from a highly trusted source needs to be scrutinized.
Now if you work with data every day in a familiar format, from the same source and with no changes to the data gathering and storage process you don’t have to spend much time validating it. Usually you will see problems when something just doesn’t look right when you are doing the analysis.
On the other hand, things get a whole lot trickier when you are using data from a source you don’t use often, or something has changed in the way the data is populated or if it’s the first time you are using the data.
When this happens, I have a few suggestions on how to validate the data.
- First off, pull the data, do your analysis and draw some conclusions. If it passed the eye test and it feels ok to you, then your job is just to validate it.
- One simple way to do this is pull the data again the exact same way to make sure you get the exact same data. Or change one parameter like the dates used in the query. See if that significantly alters the way the data looks and feels.
- Another option is to have someone else do the same thing independently. See if they get the same results you do. You can also find someone who knows the data to look over your work to see if it makes sense to them.
- Whatever you do, the best way to prevent publishing or using bad data is to involve someone else. Not always possible, I know, but it’s the best way to go.
Another suggestion is to (1) get the data, (2) do some analysis, and then (3) step away for a while. Come back to it with fresh eyes. Don’t let our minds play tricks on us by making us see what we want to see and not what is really there.
I have seen several articles showing research that most time doing data analysis is actually spent cleaning data. In a lot of businesses, the data lake has become a data swamp, clogged with bad or unusable data. As the % of unstructured data increases daily, it’s easy to see how data swamps have become the norm. Even the most robust data collection and mining can run afoul if the data is not trustworthy.
I can’t stress this enough. No matter how good you are at analysis, or what tool you are using to do the analysis, if you don’t have an understanding of what happens to the data before it gets to you then you are probably not drinking from a clean lake.

DMAIPH – Decision-making, Analytics & Intelligence Philppines
Over the past few years businesses in the Philippines have invested heavily in big data, analytics and data science, but still have not achieved the expected outcomes of data-driven companies.
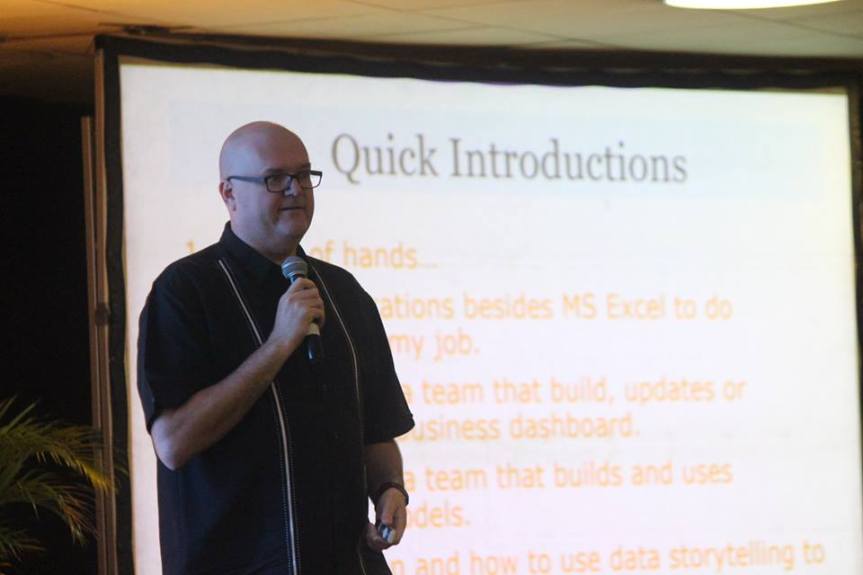
Based on our learnings from the 100’s of Filipino businesses and 10,000s of Filipinos who have taken part in DMAIPH Analytics trainings all across the country, we have crafted a proven, non-technical approach to upskilling your team in analytics.
In 2019, we will be launching two new training programs: (1) Our DMAIPH Applied Analytics Master Class series for executives, leaders and decision-makers and our (2) DMAIPH Applied Analytics Boot Camp series for practicing analysts.
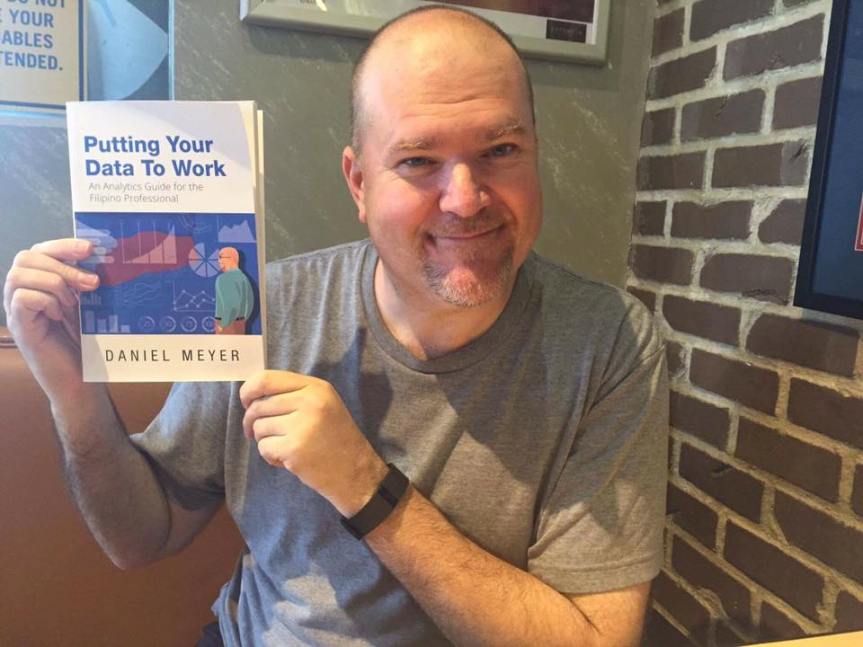
We will feature case studies of real Filipino run business, exercises based on actual analytics challenges being solved by Filipino analysts, and provide you with a copy of my book, Putting Your Data to Work, an analytics guidebook for the Filipino professional
Connect with us via our marketing partner, http://www.sonicanalytics.com to learn about upcoming analytics trainings and events.