If Amazon is investing in up skill training, because they can see what’s coming, why wouldn’t everyone else? Offering companies analytics and data science up skill training seems like a sound business model right? And that my friends, is why we have Sonic Analytics.
I ran a data science-centric program the past 18 months to do just this for Accenture’s Philippines operation. We put over 500 Accenture employees through our Applied Analytics Training Series covering topics like Data Mining, Blending and Visualization, discussed case studies by the likes of Google, Best Buy and HP, and conducted exercises giving attendees a chance to design business dashboard prototypes, build predictive models in Excel and practice data story telling. We can do the same for you.
Dan Meyer heads Sonic Analytics, an analytics advocacy with offices in Manila, the San Francisco Bay Area and as of February 2019, Ocala, FL. With over 20 years in Big Data, Dan is one of the most sought-after public speakers in Asia and has recently begun offering public training seminars in the United States. Dan has also recently joined the Powerteam International family as a small business analytics resource speaker.
Sonic Analytics(www.sonicanalytics.com) brings big data analytics solutions like business intelligence, business dashboards and data storytelling to small and medium sized organizations looking to enhance their data-driven decision-making capabilities. We also advocate the use of analytics for civic responsibility through training, consulting and education.
I’m often asked how investing in analytics will make a small business more profitable?
In my answer, I often quote a few data points from a study of 400 companies that the consulting firm Bain conducted. They found the companies with the most developed analytics capabilities commanded a larger market share. In addition, they were twice as likely to be in their sector’s top 25% for profitability, and five times more likely to make swifter decisions than competitors. Considering these statistics, businesses that are not exploiting the potential of big data analytics are certain to fall behind.
Sometimes I mention a study by the University of Texas that analyzed data sets from Fortune 1000 corporations and measured the impact data analytics had on profits. Some notable findings included:
Companies could increase profit by more than $2 billion a year by making just 10% of available data usable.
Return on equity increased by 16% by making data more accessible.
When advanced reporting was deployed, return on investment increased by 0.7% — which is equal to $2.87 million in additional revenue.
Most importantly, a comparably low investment in data analytics was required to produce these significant gains.
But just quoting a bunch of statistics is far from compelling.
That’s one of the challenges of “selling” big data solutions to small businesses. All the stats are not very relatable.
It takes time to get to know a business in a way that a tailored solution can be designed. Every business uses data differently, so no two solutions are the same.
That is why I walk entrepreneurs, small business owners and leaders through an assessment. With this we link hinderances in their analytics process to solutions that mitigate the hinderances. We can also look for technologies to optimize the storage, analysis and presentation of data. Only then can we set targets to achieve the benefits mentioned in the Bain and UT studies.
And for me that is both satisfying as business coach and fun as a data nerd.
Dan Meyer heads Sonic Analytics, an analytics advocacy with offices in Manila, the San Francisco Bay Area and as of February 2019, Ocala, FL. With over 20 years in Big Data, Dan is one of the most sought-after public speakers in Asia and has recently begun offering public training seminars in the United States. Dan has also recently joined the Powerteam International family as a small business analytics resource speaker.
Sonic Analytics(www.sonicanalytics.com) brings big data analytics solutions like business intelligence, business dashboards and data storytelling to small and medium sized organizations looking to enhance their data-driven decision-making capabilities. We also advocate the use of analytics for civic responsibility through training, consulting and education.
As citizens of this great democracy, we need to look at the data (analytics), plan a course of action (strategy) and share our data-driven viewpoints (presentation). This approach to a data savvy work force starts in school. So, we started an internship program to empower our youth to use Analytics, plan Strategy and Present their insights… ASP!
When not training current and future analysts, you can find Dan championing the use of analytics to empower data-driven citizenship by volunteering his expertise with schools and non-profits dedicated to evidence-based social progress like Saint Leo University’s Women in Data + Science Program and the Data + Women of Tampa Meet Up Group.
For those of you who follow me and have not yet attended one of my trainings, I want to share with you what we do. Here are some excerpts from a recent talk I gave in Chicago with Powerteam International.
Let’s talk about how to master your data to increase your income. Over the next couple of blog posts I’m going to walk you through some tips on how to increase the insight you glean from your data and use that to increase yyour income. We’re going to cover five things.
First of all, we’re going to talk about how big data is a wave of disruption. It’s causing massive disruptions in every industry and every type of business. We’re going to talk about how data analytics is a process. You have to be able to understand the entire process, to be able to master the data in your business.
Next, we’re going talk about how to find the right data at the right time. Like anything worth finding, this will require a map. You have to be able to look at your data throughout your business like you’re mapping something and going from start to finish.
We will next cover talking making impactful data visualizations. It is actually something that is quite hard to do, so I am going to talk about some tips on how to make some better visualizations.
Then finally we will cover storytelling with data, which is how you influence decision makers.
To recap…
1. Big Data is Disruption
2. Analytics as a Process
3. Finding the Right Data
4. Data Visualization
5. Storytelling with Data
I generally cover this subject matter over a two-day course, but for written consumption I have condensed it.
I have made it very layman.
So, we’re not going sit here and go through a lot of complicated technical stuff. This is more of a high-level perspective of my experience. Of what I know about analytics and why I want to share with you.
A little about me, so I have about 20 plus years of experience working with analytics or data analysis work. Most of my professional experience came with Wells Fargo Bank.
I worked for 15 years with Wells Fargo’s as a senior analyst. For the last seven or eight years though after I left Wells Fargo, I set up my own business. I’ve been teaching people how to be analysts. Talking to companies about how to use more data in their decision-making. Talking to people about how to really level up with their business.
I’ve been doing a lot of that in Asia and I just recently moved to Florida. I am expanding my business towards the East Coast and up here in Chicago. I also have a master’s in education. I was a teacher before I was an analyst. My favorite thing to do is talk about analytics in a way that could help empower people. This is me fulfilling my destiny.
I have a company called Sonic Elevate. Since 2011, we have trained over 8,000 people. Conducted over 186 trainings. We’ve worked on over 50 projects across Southeast Asia.
We at Sonic, work with a wide range of companies, a broad spectrum of types of businesses. The one thing they all have in common is they all have a lot of data and they’re all struggling to use that data effectively. It doesn’t matter how big or how powerful or how amazing a company is. They have to really look at data in a way that allows them to constantly optimize this.
I want to share with you a few of those things that some of these companies do within the framework of the outline I listed above.
Big Data, Analytics, Data Governance, Data Visualization and Storytelling with Data.
If you want to attend a training or set up some time for a 1 on 1 coaching session, let’s connect.
Dan Meyer heads Sonic Analytics, an analytics advocacy with offices in Manila, the San Francisco Bay Area and as of February 2019, Ocala, FL. With over 20 years in Big Data, Dan is one of the most sought-after public speakers in Asia and has recently begun offering public training seminars in the United States. Dan has also recently joined the Powerteam International family as a small business analytics resource speaker.
Sonic Analytics(www.sonicanalytics.com) brings big data analytics solutions like business intelligence, business dashboards and data storytelling to small and medium sized organizations looking to enhance their data-driven decision-making capabilities. We also advocate the use of analytics for civic responsibility through training, consulting and education.
As citizens of this great democracy, we need to look at the data (analytics), plan a course of action (strategy) and share our data-driven viewpoints (presentation). This approach to a data savvy work force starts in school. So, we started an internship program to empower our youth to use Analytics, plan Strategy and Present their insights… ASP!
When not training current and future analysts, you can find Dan championing the use of analytics to empower data-driven citizenship by volunteering his expertise with schools and non-profits dedicated to evidence-based social progress like Saint Leo University’s Women in Data + Science Program and the Data + Women of Tampa Meet Up Group.
I know I’ve had an interesting career when I get excited about a news article announcing the merger of the Philippines biggest name in fast food with a California based coffee chain.
Why? Because I’ve trained business analysts from both companies and have some insights into how both of them work with their data.
For those of you who aren’t familiar with Jollibee, it’s basically the Filipino McDonalds but with a lot of Filpino-centric fast food options and a much cuter mascot. They dominate their home market and they have expanded around the globle. Where ever your find significant pockets of Filipinos, you can find a Jollibee.
As for Coffee Bean (CBTL) its a California based coffee and tea chain that lives in the Starbuck’s shadow. The have a fairy random footprint and really aren’t the first coffee of choice anywhere I know of.
But for Jollibee it seems like a smart move to acquire Coffee Bean. A lot of CB locations are in malls and business hubs are off to the side and not front in center. They couldn’t compete with the Starbucks for the same floor space and that reality makes them mostly an after thought.
Plus there is nothing special about their menu. Nothing bad, but nothing great either. Plus they have an ever growing amount of competition in a market (coffee) that may be peaking as younger customers like alternatives like milk tea and pearl tea.
On the other hand, Jollibee is an absolute monster of a competitor. They dominate the lower end of the market. Adding CB gives them a presence in more higher end market places. In a lot of malls and business districts, Jollibee is either not present or stuck in the basement with the other fast food brands. But CB can be front in center right. If Jollibee infuses some cash into improving the location of the CB stores, it should be pretty successful.
Plus Jollibee’s marketing is one of the best in the business. They consistently product content that is heartwarming, enchanting and really works. And the bee, that is one of the most beloved mascots I have ever seen. Way better then a quasi creepy clown or a very outdated southern colonel. If they can get people feel the same way about a cup of CB coffee they do about a yumburger, that its a golden marraige.
One more thing, I always mention when I talk about Jollibee. I can 100% guarantee, that in any room full of Filipinos, there is one thing they have all done. No matter their age, income, education.. .they have all attended a birthday party at a Jollibee. If you think McDonalds is a pure representation of middle America, than times that by 10 and you get what Jollibee is to the Filipino.
Now that all just on the outisde. On the inside, Jollibee has spent a lot on its internal data processing and decision making. They have crushed McDo in the Philippines based on an old school model of overwhelming numbers. But since then, they have gotten smarter. I saw that in their analysts and the way they were using data to solve business problems. There success is multifaceted, but a key pieces of it is their business culture is much more data-centric than their competitors. They have a deep and wide ranging strategy to keep adding complementary pieces (they bought the Philppines Burger King franchise last year) to the brands they offer… now they have added another potential winner.
Expectedly, Jollibee’s stock took a dive the day after the announcement on the Philippines Stock Exchange. Short term mindset and conservative investors worry its a mistake to get into the coffee business and many are still waiting to see how the Burger King acquisition plays out. But not me. Based on what I’ve seen, inside and out, I think its a shrewd move.
Dan Meyer heads Sonic Analytics, an analytics advocacy with offices in Manila, the San Francisco Bay Area and as of February 2019, Ocala, FL. With over 20 years in Big Data, Dan is one of the most sought-after public speakers in Asia and has recently begun offering public training seminars in the United States. Dan has also recently joined the Powerteam International family as a small business analytics resource speaker.
Sonic Analytics(www.sonicanalytics.com) brings big data analytics solutions like business intelligence, business dashboards and data storytelling to small and medium sized organizations looking to enhance their data-driven decision-making capabilities. We also advocate the use of analytics for civic responsibility through training, consulting and education.
As citizens of this great democracy, we need to look at the data (analytics), plan a course of action (strategy) and share our data-driven viewpoints (presentation). This approach to a data savvy work force starts in school. So, we started an internship program to empower our youth to use Analytics, plan Strategy and Present their insights… ASP!
When not training current and future analysts, you can find Dan championing the use of analytics to empower data-driven citizenship by volunteering his expertise with schools and non-profits dedicated to evidence-based social progress like Saint Leo University’s Women in Data + Science Program and the Data + Women of Tampa Meet Up Group.
When you least expect it, that is when it happens.
When you stop looking for something, what you are looking for finds you.
At least that is what happened to me the past two days as I attend a couple of amazing events produced by Powerteam International.
48 hours ago I was in a bit of a funk.
Maybe more than a bit of funk. It was actually about fourteen months ago when I came to the conclusion that I needed a new mountain to climb.
I am one of those people who live for the journey, not the destination. When I check off all of the boxes I wanted to check off in a certain pursuit, I need to move on to something different.
So when I pretty much achieved all I had set out to do in the Philippines, I started looking for something new to do back in the U.S. My absolute favorite thing to do is talk about analytics in front of an audience hungry to level up with their ability to optimize data. It took 8 years, but I had pretty much become the biggest name in analytics training in the Philippines. So what is my follow up to that?
I spent the past year plus exploring how to get more involved in using analytics for civic responsibility and advocating for a more data-driven electorate. However, I just couldn’t find a place where I could pour my passion into.
Long story short, that brought me to the Small Business Expo in Orlando two days ago.
Having just spent a day exploring Disney’s Animal Kingdom, I was mentally well rested and ready to get out there and network as I was planning to basically rebuild my training advocacy that I had built in the Philippines, but now in North Central Florida.
One more point, before talking in depth about my Game Changing Day.
I took this private tour safari at the animal park. I was setting out on the deck overlooking the savannah section of the park watching giraffes, spring buck and really, really big horned cows as the sun started to set.
It was a beautiful moment. And honestly it was not cheap. It cost like $180. But man was it worth it.
I said to myself, I love this. I want to keep doing this kind of stuff. But I’m gonna need to make a lot more money if I want to really have the lifestyle I want.., to travel, to explore, to experience. In short, I need to be rich to get to the top of my next mountain.
Unsure how I would get there, but ready to start a new chapter I entered the Expo.
At first glance it was like any number of similar expos that I have been to over the years. A bunch of workshops, an exhibitor area, a main stage with a bunch of speakers I hadn’t heard of before. So I got into networking mode.
Attending a couple of workshops and walked half the exhibitor area, picking up a few ideas and 1–2 good leads. And then it all changed.
I attended a workshop by a guy named Bill Walsh. Yeah being a lifelong 49ers fan, that was the main reason I picked this workshop.
Before I knew it, I had filled up several pages of notes. Like how to use your book to build your business without even finishing the book. I mean Bill was giving me a lot of really good small business ideas that make a ton of sense. Another that stuck out was the idea of selling from stage. Honestly, the fact that I was getting all this for free was quite remarkable.
And then the sales pitch came. Like most speakers Bill had something to offer us. In this case a Public Speakers Camp. Five days of intense training to up your game as a speaker to really optimize your time on stage. Sounds awesome. The kicker, the price tag was kinda high… probably too high for 90% of the attendees.
So at the end, I hung around. Fired up by the pages of notes I had taken and seeing the potential that abounds in what Bill said. I really could focus more on my passion (public speaking) to offer what I am good at (analytics training) that will enable more of my prime motivator in life (travel).
I got a deeper understanding on the offer and started to sense it could be a game changer. It’s a significant investment, but if it pans out this could shave two years off of my business development plan. I could easily be making 7 figures in the near future.
The Platinum Speaker Program, five days with 20 like-minded individuals being taught by Bill. All kinds of help with refining your offer, polishing you message and picking up best practices. With a promise to be put in stage within 60 days. Sounds kinda too could to be true right?
That’s what most of us would think. And we would never stop thinking.
But I get it. I see exactly how this would benefit someone like me.
So I signed up.
But I still didn’t appreciate the scope of what I had signed up for.
After talking with Bill, I went back to the exhibitor area. And started to fit the pieces together.
Several of the speakers had done what I was doing. And one after another, as I spoke to them, Deann, Merri-Jo, Tina, Sheridan, Angel… validated my thoughts that this is something I should be part of.
The Small Business Expo is THE stage that the graduates of the program are put on. They get to talk about their area of expertise and offer their services while also sharing what Powerteam does for its speakers.
It’s brilliant.
I’ve been a speaker at many, many events where part of the speaker lineup (including myself) is working closely with the event organizers to develop additional post workshop activities to partner on.
But this one, the Small Business Expo series… it’s the best I have ever seen.
It will get me on stage, to build my advocacy, to grow my business and take me all around the world.
For me it is that game changer I had been looking for, but did not expect to find it here.
Boom! I got my mojo back.
Now off to climb a new mountain.
Dan Meyer heads Sonic Analytics, an analytics advocacy with offices in Manila, the San Francisco Bay Area and as of February 2019, Ocala, FL. With over 20 years in Big Data, Dan is one of the most sought-after public speakers in Asia and has recently begun offering public training seminars in the United States. Dan has also recently joined the Powerteam International family as a small business analytics resource speaker.
Sonic Analytics(www.sonicanalytics.com) brings big data analytics solutions like business intelligence, business dashboards and data storytelling to small and medium sized organizations looking to enhance their data-driven decision-making capabilities. We also advocate the use of analytics for civic responsibility through training, consulting and education.
As citizens of this great democracy, we need to look at the data (analytics), plan a course of action (strategy) and share our data-driven viewpoints (presentation). This approach to a data savvy work force starts in school. So, we started an internship program to empower our youth to use Analytics, plan Strategy and Present their insights… ASP!
When not training current and future analysts, you can find Dan championing the use of analytics to empower data-driven citizenship by volunteering his expertise with schools and non-profits dedicated to evidence-based social progress like Saint Leo University’s Women in Data + Science Program and the Data + Women of Tampa Meet Up Group.
We create data everyday. How? We, especially in this generation spend many hours in accessing our social media accounts, doing online shopping, playing games, watching movies online. Part of our daily routine includes internet and technology. By doing so, all of our hobbies generate data that are captured in various places and in different ways.
Every time we post pictures on Instagram, rant something on Twitter and post our status and photos on Facebook, we create a lot of data. There is a corresponding data point every time we comment or like something online. Imagine how many data we can generate everyday if every person of this planet accesses online.The data become closer and closer to infinity. That is why the term “big data” was created.
With that being said, data analytics is key to handle pool of data. Analytics is about searching for clues that will enable us to find answers to our problems. We find, we analyze and we present our data.
Primary people for conducting analytics are called analysts.The problem would be that they are overwhelmed by massive amount of data and have trouble to handle them properly.
In order to be effective, analysts should master effective and current business intelligence (BI) tools that could help them to interpret the data properly and guide the companies and businesses regarding their strategies and decision making processes.
I started having interest in dealing with data when I was 3rd year in college. Before, I was a Math person. I am the kind of person who likes challenging activities and work on complex subjects. In the pursuit of my Economics degree, I used a lot of data and created graphical representations in order to survive essay crises and loads of research papers.
Somehow, economics has the same idea as data analytics which is to tell a story out of the representations. The difference lies upon the frequency of the usage of business intelligence tools in data analytics.
Why did I dive into data analytics? It fits my personality, hobbies and skill sets. I am curious in nature and love to learn new things. I love editing videos, photos and creating infographics and graphical representations. And data analytics made me combine all of these hobbies in data analytics. It enables me to be creative, analytical and communicative all at once. There is no wrong and right approach. I can be my own self. As long as I get the right data, visualize and verbalize them well, I’m good to go.
Data analytics gave me a sense of purpose. I think in this generation, being an effective analytics talent is what the world needs. I do not mean to disregard other jobs. I just want to be realistic about the present and the future. More and more businesses will build their companies using online platforms requiring more data analytics talents. If businesses do not adapt to the demands of the society, they will most likely fail. As a student and future professional, I need to prepare for these changes. Although I have a background in dealing with data, I need to learn timely business intelligence tools and to train myself to be a better data storyteller.
DMAIPH can help analysts and aspiring individuals who want to learn data analytics. The company conducts trainings to help increase effective and efficient analysts in the Philippines and meet the demands of the society when it comes to data enthusiasts.
EXPERIENCE
Last September 25 and 26, I attended the training of Sir Dan Meyer regarding Data Management and Data Visualization. In a span of two days, I was able to have an overview of how data analytics works and how to use business intelligence tools to tell a story. Moreover, I was also assigned to tasks like to welcome the guests and to assist Sir Dan in helping the participants to use Tableau since I also need to fulfill my duties as a business analytics trainee.
At first, I was really intimidated with the participants when they introduced themselves. I never thought that the people whom I say “Good Morning/ Hello” to are CEOs and various kinds of analysts in their respective companies. This really reflects that the demand for analytics talents in the Philippines is greater than the supply. When I talked to some of them, they said that companies have sent them to have trainings with Sir Dan and some of them personally wanted to learn to help their companies.
Training people is really a must to adjust in this day and age. As time goes by, more and more data are generated and unstructured data gradually increase. If data continue to produce increments, the world needs more and more analysts to handle them. In the case of the Philippines, Excel still dominates the analytics industry and is used primarily by professionals to conduct data analysis despite the evolution of business intelligence (BI) tools. On the second day of the training, the practical application of the concepts taught in Day One were applied. Sir Dan tackled about business intelligence tools, data visualization, business dashboards and data storytelling.
I have 5 major takeaways that I want to share with you:
Data Visualization is just half the job. We need to interpret the data correctly and relay the information such that a grade school student can understand the story behind the data. This is in order to create an impact to various kinds of people and encourage decision-makers to make relevant changes in their businesses. Just be simple and precise!
Learning data science and analytics is all about experimentation. We shall be ready for mistakes along the way. We must continuously attend trainings in order to guide us and persistently practice on our own to obtain mastery.
Companies are enchanting because people like them and trust them. As part of a company, we want to reflect the enchantment our companies have to give to the customers. Without the right strategies to be enchanting, people will not believe us leading to a low profitability and a bad reputation. We can be enchanting as analysts if we can deliver the data persuasively and we can work well with other people.
Being an effective data scientist is a combination of being mobile when it comes to changes in technology and being adaptable in dealing with people.
There are three types of analytics which include descriptive, predictive and prescriptive. How do we use them properly? Descriptive analytics can be effectively utilized if we want to know what happened to have insights in present trends. For example, we want to know about the profits in each month from 2015-2017. Secondly, predictive analytics is used to develop projections and provide information what might happen in the future. Expected sales can be best represented by predictive analytics. Lastly, prescriptive analytics is used to know what to do. We can use this especially if we want to build a model out of multiple sources and include many variables.
DMAIPH: FIRST TRAINING, FIRST INTERNSHIP
DMAIPH really provided me a brand new experience. Although I love dealing with data and graphical representations before I become an intern, I felt more impactful when I started my training. I got to help the participants how to navigate Tableau and had to work with wonderful people. I was able to apply what I learned in the past and at the same time acquire new skills that will be beneficial for me in the future. I look forward to the trainings and more involvement that I can get from the company.
So far, so good.
ABOUT THE AUTHOR:
Maureen Lepatan is an Economics student in De La Salle University and currently a business analytics intern in DMAIPH. She has a passion in data analytics especially using business intelligence tools such as Tableau and Excel. She has an eagerness to learn data structures such as SQL.
Recently saw this article on KDnuggets (check them out if you aren’t already subscribed)and thought it was worth using to update some of my slides about the current talent shortage for Data Science & Analytics (DSA) skills.
This shortage is definitely acute here in the Philippines.
The 2011 McKinsey report on Big Data said that “The United States alone faces a shortage of 140,000 to 190,000 people with analytical expertise and 1.5 million managers and analysts with the skills to understand and make decisions based on the analysis of Big Data.”
In 2014, KDnuggets examined “How Many Data Scientists are out there?” and came with an estimate of 50-100,000, and did not see much evidence of a massive shortage then. In 2014, we found only about 1,000 job ads for “Data Scientist” on indeed.com.
Now that we reached 2018, KDnuggets has examined how accurate were those predictions and tried to answer three questions:
1. Is there a shortage of Data Scientists now?
2. How many “Data Scientists” are there , both in name and in function ?
3. What are the future prospects for Data Scientists?
The answer to the first question is a resounding YES!
LinkedIn Workforce Report for US (August 2018) says “Demand for data scientists is off the charts … data science skills shortages are present in almost every large U.S. city. Nationally, we have a shortage of 151,717 people with data science skills.
Note that LinkedIn reports shortages for people with “Data Science Skills”, not necessarily people with “Data Scientist” title.
We can estimate the demand for “Data Scientists” from two popular job search sites – indeed and Glassdoor.
Search on indeed.com for “data scientist” (in quotes) in USA finds only about 4,800 jobs. However, in a search for data scientist without quotes, about 30,000 jobs.
US is the largest but not the only market for Data Scientists. We can also see strong demand for Data Scientists elsewhere:
UK: 1,100 jobs
Germany: 900 jobs
France: 718 jobs
Philippines: 599 jobs — You Read That Right! More than India.
India: 500 jobs
Glassdoor search for “Data Scientist” finds about 26,000 jobs in USA (same results if quotes are removed).
Question 2: How Many “Data Scientists” are There, Both in Name and in Function?
Google search defines a data scientist as “a person employed to analyze and interpret complex digital data, such as the usage statistics of a website, especially in order to assist a business in its decision-making.”
There are many people in the industry and academia who do this work without having the formal title of a data scientist, since Data Science is an interdisciplinary field at the intersection of Statistics, Computer Science, Machine Learning, and Business. We can estimate the current population of Data Scientist by examining popular data science platforms.
Kaggle (now part of Google) is a platform for data science and analytics competitions. It claims to be the world’s largest community of active data scientists.
While not all Data Scientists take part in Kaggle competitions or have a Kaggle account, and not all Kagglersdo work of data science, it is reasonable to assume a large overlap.
On Sep 19, 2018 Kaggle says they surpassed 2 million members in August 2018.
Since not all Kaggle members are active, Kaggle membership is probably a global upper bound for people engaged in data science.
KDnuggets is now reaching over 500,000 unique visitors per month.
KDnuggets now has about 240,000 subscribers/followers over Twitter, LinkedIn, Facebook, RSS, and email.
On LinkedIn, there are many groups dedicated to data science, and although the engagement in those groups has been falling, we can use their membership as a rough estimate. Here are three of the largest groups
Big Data and Analytics – 339,000
Data Science Central – 278,000
Data Mining, Statistics, Big Data, Data Visualization, and Data Science – 170,000
Searching LinkedIn for “data scientist” (quotes are important) we find over 100,000 people with that actual title. So if globally between 200,000 and 1,000,000 people are doing some Data Science related work, then a majority of them does not have a Data Scientist title.
We can also estimate the by looking at activities related to languages and platforms most connected to Data Science: R, Python, Machine Learning libraries, Spark, and Jupyter.
Apache Spark Meetups had 225K members recently and growing every month.
Intel Capital estimated that there 1 million R programmers worldwide.
Based on the public data on python.orgwebsite, there have been around 2.75 million downloads.
Jupyterproject has around 3 million users at present.
These numbers can give us a rough upper limit on the number of data analysts/data scientists around the world.
So yeah, to answer the question, there are at least 200,000
Question 3: What are the Future Prospects for Data Scientists?
The near-term future for Data Scientists looks bright.
LinkedIn 2017 emerging jobs report claims that machine learning engineers working today has increased by 9.8 times as compared to 5 years ago.
Machine Learning Engineers, Data Scientists, and Big Data Engineers rank among the top emerging jobs on LinkedIn. Data scientist roles have grown over 650% since 2012.
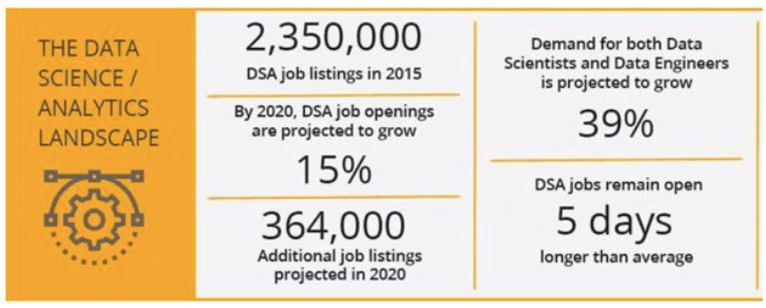
Job growth in the next decade is expected to outstrip growth during the previous decade, creating 11.5M jobs in the Data Science/Analytics area by 2026, according to the U.S. Bureau of Labor Statistics.
IBM recently claimed that by 2020 the number of Data Science and Analytics job listings is projected to grow by nearly 364,000 listings to approximately 2,720,000. No matter what the true number of data professionals out there currently, their number is likely to grow in the near future.
So What are the Future Prospects for Data Scientists in the Philippines?
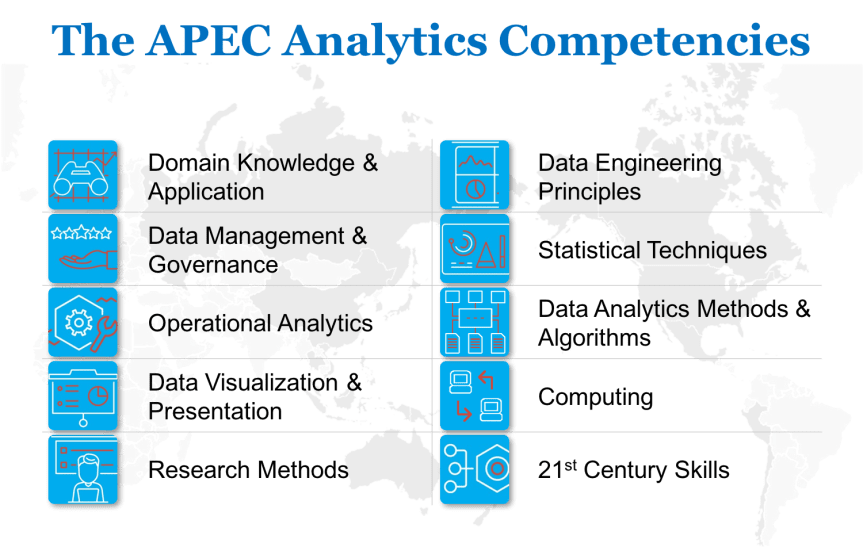
Based on Data from APEC (Asia Pacific Economic Cooperation), there is both a huge demand here in the Philippines as well as in the jobs where the Philippines already has an outsourcing pipeline too.
SO what does that mean for you?
You Need to Know Exactly What You Need to Hire/Learn how to have/be a Data Scientist?
And it’s not easy.
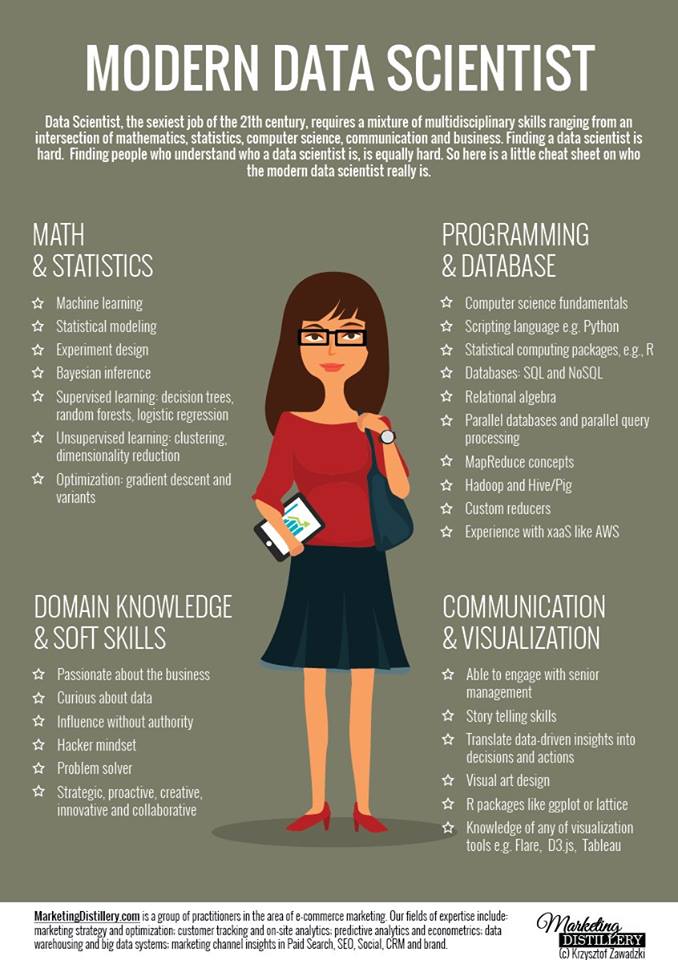
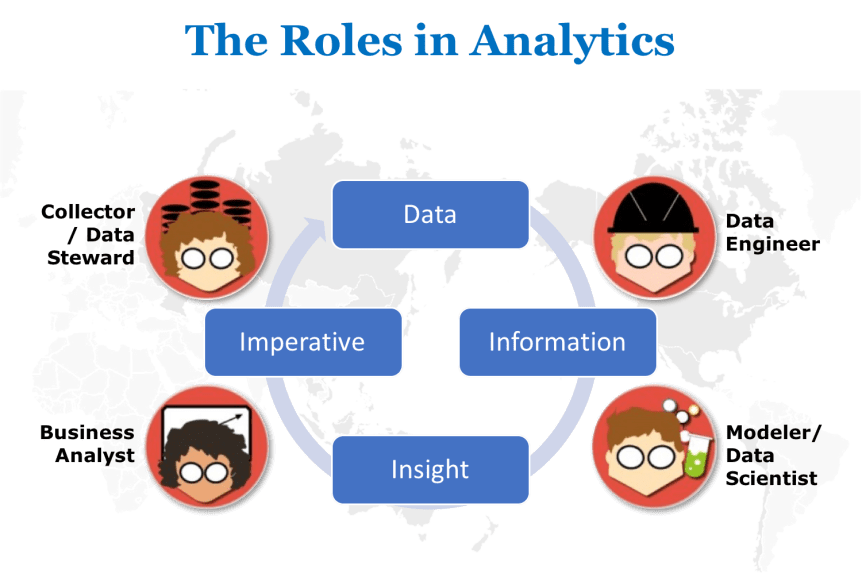
To assemble a team of DSA Practitioners, you need to make sure you have the right combination of talent.
Here is how I would start.
Make sure you have people who can do these functions.
And if you want to learn how to be one of these key players, I’m betting you need to know where to start.
So wether you want to be a DSA enabled professional or you want to assemble a DSA team, here is a better understanding of how that looks.
Over the past few years businesses in the Philippines have invested heavily in big data, analytics and data science, but still have not achieved the expected outcomes of data-driven companies.
Based on our learnings from the 100’s of Filipino businesses and 10,000s of Filipinos who have taken part in DMAIPH Analytics trainings all across the country, we have crafted a proven, non-technical approach to upskilling your team in analytics.
In 2019, we will be launching two new training programs: (1) Our DMAIPH Applied Analytics Master Class series for executives, leaders and decision-makers and our (2) DMAIPH Applied Analytics Boot Camp series for practicing analysts.
We will feature case studies of real Filipino run business, exercises based on actual analytics challenges being solved by Filipino analysts, and provide you with a copy of my book, Putting Your Data to Work, an analytics guidebook for the Filipino professional
Connect with us via our marketing partner, http://www.sonicanalytics.com to learn about upcoming analytics trainings and events.
Do you think this is still the career era for nurses? The era of Physical Therapist? The Networking era? The I.T eras? Why don’t you try to type in google right now and search “Most in demand jobs in the future” and you will mostly find “Analyst” on every job description in demand in the future. The worst case is that you will also discover the worst job in the future, if you have been caught on that category. I say we are here to save you.
We are here to help you start building your future right now
And be the first one to learn and know what is in demand. We are here to supply you knowledge and provide you a strong foundation in analytics. We have the same curiosity when it comes to analytics? Trust me, I’m not a big fan of numbers, but I’m wrong, I never thought analytics also plays a role in giving us a perception through data visualization with the right purpose of using numbers. Not just some numbers you need to compute instructed by your professors to do so.
It’s all about numbers but.
It also equips with visualization with easy number to analyze. If you notice right now visualization plays an important role in our digital age today. Because we prefer to see imagery instead of computation, we prefer reading pictures instead reading books. Analytics have the same concept and there is a huge shortage of people who are skilled in working with data to answer questions to solve problems.
For those who are interested in or just beginning a career in data analysis,
here’s a few tips to help you get started,
Be willing to learn,
Being a sponge in learning data analysis (and with any field) can only reap the benefits. With data analysis, it’s important to start small and learn the basics and foundations before moving on and tackling bigger things.
Building a solid foundation of education in the beginning helps you know the basics and allows you to work on building your skills and knowledge as you progress through your career.
Don’t be afraid to ask questions and get help
You can’t do it alone, and not seeing out help can cost you opportunities as you progress through your career. Reaching out isn’t a sign of defeat or being unknowledgeable, it shows that you’re passionate and want to learn more but need the proper guidance to get you there.
Becoming a data analyst is a great career option for those who love to work with numbers with the right tools (We will guide you) to help you and to help companies, organizations draw conclusions and arm them with the information they need to make for decision making.
If you’re a beginner,
Don’t worry, we are here to teach you the important fundamentals of data analytics step by step in a layman’s term.
Now, it’s your big chance to participate in our upcoming trainings which focuses more on teaching young professionals like you.
DMAIPH is proud to present this 3-day Data Analytics training that covers different aspects of data identification, collection, storage, transformation, and analysis and involve hands-on use of common data management and analysis tools such as Excel, SQL and in depth learning of the tool “Tableau”, this is also designed for those with little to no prior experience with these tools.
Attendees will learn how to identify the right data, how data can be efficiently stored, then transformed into a friendly form for analysis, and finally how data analysis can yield insights.
DMAIPH is proud to present this 3-day Data Analytics training that covers different aspects of data identification, collection, storage, transformation, and analysis and involve hands-on use of common data management and analysis tools such as Excel, SQL and in depth learning of the tool “Tableau”, this is also designed for those with little to no prior experience with these tools.
Analytics Experts Dan Meyer (DMAIPH) and Dominic Ligot (Cirrolytix) have joined forces to offer a unique training focusing on both the Analysis and the Management of Big Data.
Attendees will learn how to identify the right data, how data can be efficiently stored, then transformed into a friendly form for analysis, and finally how data analysis can yield insights.
LEARNING SESSION OBJECTIVES:
Apply cutting edge technologies to organize, interpret, and summarize Big Data in your business.
Create a process to analyze data and identify patterns not apparent at first glance
Understand the components of The Data Value Chain: Ingestion, Storage, Transformation, Analysis – and how they are all important to deriving value from data.
Learn database manipulation and processing basics using the Structured Query Language (SQL)
Connect a data analysis tool such as MS Excel or Tableau to a database to be able to perform analysis on processed and stored data
IN THIS SESSION, YOUR ORGANIZATION WILL BE ABLE TO USE:
Specific skills to effectively frame the problem you’re addressing to uncover key opportunities and drive growth
Critical marketing steps of orientation necessary before engaging tools and technology
How to simply and quickly amplify decision making by separating the signal from the noise
A framework for asking the right questions, allowing the ability to link analytics to business strategy
IN THIS SESSION, YOUR PARTICIPANTS WILL BE ABLE TO:
Learn the best practices for organizing, summarizing, and interpreting quantitative data
Create a repeatable process for analyzing your data
Shorten the time between analysis and action to avoid “analysis paralysis”
Know how to get from hard data to well-reasoned conclusions
WHO SHOULD ATTEND:
Business Analysts, Data Analysts and other Analytics Professionals
Business professionals who are involved in day-to-day analysis of data.
Data analysts who are already performing analysis using spreadsheets but struggle with manual data processing.
Managers of analysts or staff who spend a significant amount of their time collecting analyzing and reporting data.
IT and Development Staff that work closely with business leaders and decision-makers.
The Asian Institute of Management (AIM) recently conducted a free Master Class last January 15-17, 2018 about the application and use cases of Data Science to different fields. It was also a venue for them to provide more information and some insight about the relevance and competitiveness of their newly proposed course, the MS in Data Science (MSDS) Program. The Master Classes aimed to provide some perspective on role of Data Science in the business world today.
During the second day, AIM focused on the applications relevant to the Finance and Banking sectors. The session which was primarily conducted by the Institute’s MSDS Program Director Erika Legara, PhD. She talked about the place of data science in business and emphasized on the importance of the data scientist’s ability to communicate his/her findings to the business decision makers effectively. Let me highlight some of the things I found particularly relevant. A good data science team is crucial to leveraging on company curated data as most often than not, good amounts of historical data are left untouched or under-utilized. This is because people in the business are rarely equipped to handle data, more so transform and use it through modelling. Aside from this, it was also emphasized that analytical knowledge alone will not be enough to achieve success for the business. A data scientist should also have domain knowledge on the relevant business alongside his/her data analytics skill set and techniques. The combination of both is needed to effectively revolutionize one’s business. To sum it all, AIMs seminar was a great opportunity to get an introduction on data science and its relevance, as we know that the Philippines is now adapting to keep up with the trend.
In 2013, the Commision on Higher Education (CHED) released a memo outlining the guidelines and policies for the launching of specialized courses in business analytics targeted towards students who are taking up Business Administration and Information Technology. The goal of this endeavor is to prepare students for the big global analytics wave which will likely open up a lot of career opportunities. In fact upon the release of the memo, various schools expressed their interest to add this new program to their curriculum such as the University of the Philippines – Diliman, Ateneo de Manila University, De La Salle University, Asia Pacific College and University of Santo Tomas, among others. The visualization below shows the list of schools that have expressed interest in launching their own Data Science and Analytics programs. (Click the visualization below to open and interact with it in a separate tab).
Similar to AIM and the abovementioned schools, the Analytics Association of the Philippines (AAP) also aims to shed light on the relevance of analytics to businesses and the overall economy. As an enabling organization, we aim to come up with a unified ecosystem in the Philippines where industry, the academe, and practitioners meet and find synergies. By helping mobilize trainings and programs for Filipinos that focus on how to upskill in analytics with strong regard for business domain knowledge, we hope to facilitate the creation of a new breed of data scientists that can really revolutionize organizations. Quoting the popular magazine-format newspaper, The Economist, the world’s most valuable resource is no longer oil but data. In line with this and the objective of the AAP, we serve to help individuals optimize their practice and remain well-informed about the developments of the field to make their work more valuable to them and their respective organizations. We hope to complement the efforts of AIM and other educational institutions as we take on the same objective of upskilling Filipinos. The AAP undertakes this mission through massive and inter-regional projects throughout the Philippines, hopefully reaching the seams, and making it available to all who are eager to learn.


 And be the first one to learn and know what is in demand. We are here to supply you knowledge and provide you a strong foundation in analytics. We have the same curiosity when it comes to analytics? Trust me, I’m not a big fan of numbers, but I’m wrong, I never thought analytics also plays a role in giving us a perception through


 Don’t worry, we are here to teach you the important fundamentals of data analytics step by step in a layman’s term.