How Does a Foreigner Become a Successful Speaker in the Philippines?

“As a foreigner, how do you market and sell yourself as a speaker in the Philippines.”

A good friend of mine asked me that a little while ago.

After letting it rattle around in my head a bit, I came up with this reply.

As cliché as it sounds you have to be yourself. Although high powered, dynamic speakers can come to the Philippines to speak and make money, the ones who keep coming back are the ones who are authentic.

I also understand the heart of the Filipino. I am just one of a network of maybe several dozen Philippines based, non-Filipino speakers who routinely are asked to speak at conferences and seminars.  The fact that we have expertise in our fields of specialty is important, but I think what’s more important is that we all have chosen to live in the Philippines. That makes a significant difference.

To a person not familiar with the Philippines, who is just visiting to be a speaker, it will be much harder to really understand the heart of the Filipino. And therefore you would have to work much harder to be an impactful speaker. There will always be a lot of value in sharing knowledge and being a subject matter expert, but if you can’t put that in context of what it means to live and work in the Philippines, you will likely not succeed long term.

That said, I can point out a few things that I think would help a visitor who really wants to learn what it takes to know be successful in the Philippines.

Get outside the comfort zones. Most foreigners stay in relatively rich, safe and easy to get around areas in Metro Manila. To really get to know the Philippines you need to go to the palengke (market place), ride a Jeepney (local transit) and eat some street food (I love BBQ pork on a stick). Now, I recommend you go with a local your first time, but if you can talk about these experiences, you audience will be able to relate to you and have much more respect for you.

Traffic congestion is horrible in Metro Manila. Its an easy target for a shared experience. Saying you were worried you might be late because “Traffic sa Edsa” (traffic was bad on EDSA, the major north-south traffic artery in Manila) will also help. Actually just learning and using a few Tagalog phrases will make a huge difference.

Another suggestion I would make is don’t use up most of your time talking. Breaking into small groups discussions and having interactive learning activities will take the burden off of the audience having to always listen to having a fast-talking and intelligent, foreigner. It can be very intimidating for the audience when that happens. They end up getting, what Filipinos humorously refer to as “nosebleed”. Too much English, too fast and with too much information being the cause. So building in breaks from you speaking is another key to success.

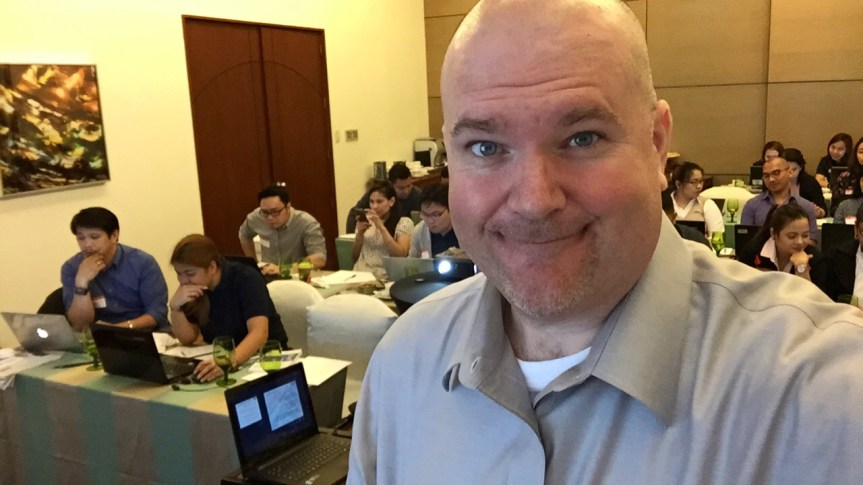
The final suggestion I’d offer my friend, would be to be social. Mix with the audience before the event starts. Be ready to say Maghanda Umaga (Good Morning) when they come in. After the first session and you are on AM break while everyone is having snacks, be ready to mingle some more. And at the end, build in time to take a group photo and group pics. The Philippines is proud to be the most Social Media driven country in the world. Selfies reign. Embrace that fact and you will win a lot of support.

As for marketing, social media and mobile are of paramount importance. You have to push a lot of mobile friendly content through social media to really draw attention to you and your training. And the more that you do to show your interest in empowering Filipinos the more success you will have.

Hope that helps!

My Analytics Story – My passion is solving problems by bringing together the best talent, cutting edge technology and tried and true methodologies. DMAIPH is all about empowering people towards better Decision-Making through the use Analytics and business Intelligence. This is what I do best. Contact DMAIPH now at analytics@dmaiph.com or connect with me directly for a free consultation about getting more analytics into your career and your business.

Most Analysts Spend 50% of Their Time Finding Data

Most analysts spend most of their time finding data.

% Finding Analyzing Reporting
10 12% 6% 33%
20 14% 10% 39%
30 20% 31% 24%
40 6% 14% 2%
50 31% 16% 2%
60 14% 18% 0
70 0% 0% 0
80 0% 2% 0
90 0% 0 0
100 0% 0 0
       

In fact, most analysts I know spend 50% of their time finding data.

Among other thing this can mean they are setting up data mining or data gathering process to look for the data or it can mean they reviewing their data for relevancy.

My experience is that when you spending this much time on the finding the right data phase it reflects a poorly structured data environment or a unfamiliarity with the data needed.

Dirty data is also a big time waste.

Experience is the best solution for challenges with finding data. The fact the finding phase % is so high speaks to both the explosion in the 3 V’s of Big Data (Velocity, Volume and Variety)  as well as the number of analytics newbies.

To me this should be no more than 20% of your time.

I expected finding data would be the biggest chunk, but was surprised that over 50% of my analyst connections using at least 40% of their time finding data.

If you have one day to answer a key business question, this means you are using your entire morning just finding the data.

When you get back from lunch you haven’t even started the actual analysis yet and the clock is ticking.

Data is based on a survey I sent to 3,000 of my LinkedIn connections who are either analysts or work closely with data and analysis.

Analytics Survey – DMAIPH conducts quarterly analytics surveys to collect data on current trends in analytics. We specialize in surveys that assess analytics culture and measuring how aligned an organization is to using data and analytics  in its decision-making. Contact DMAIPH now at analytics@dmaiph.com or connect with me directly to find out more about how DMAIPH can conduct surveys to help you assess the analytics culture in your business.

The Analytics of Measurement and Evaluation

By taking inspiration from the way corporations use business analytics to optimize their Big Data, our Program Measurement and Evaluation processes can be greatly enhanced.

To understand the connection, let’s start with the mission of the Measurement & Evaluation program.

“The ability to effectively evaluate projects, programs and processes is becoming increasingly essential to organizational success today. American University’s online Master of Science (MS) in Measurement & Evaluation provides you with the knowledge to lead these evaluation efforts and the technical skills needed for analytically demanding roles in upper management.” 1

A good analytics solution constructs a universal framework for collecting, analyzing and utilizing data to determine project effectiveness and efficiency.

Likewise, an efficient measurement and evaluation of projects, programs and policies using analytics should ensure success. An analytics centered approach will likely work with corporate, non-profit and governmental organizations across various sectors and industries.

IMG_6912

We can look specifically to two key business analytics concepts I have used in my twenty plus years of analysis work; Key Performance Indicators (KPIs) and Data Visualization. The key to my success was my ability to answer important business questions using analytics.

Analytics is generally defined as the discovery of patterns in data that provides insight and identifies opportunities. As Carly Fiorina, former CEO of HP said about analytics, “The goal is to turn data into information, and information into insight.” 2

Organizations that invest in analytics generally make much better business decisions then one’s that don’t. In fact, IBM found that organizations who use analytics are up to 12x more efficient and 33% more profitable. 3

In the corporate world, business analytics is widely use to track, analyze and report Key Performance Indicators (KPIs).

KPIs are rolled up to senior leadership to drive business strategy, identify and mitigate risk and to optimize operational productivity.

This approach is very similar to the way projects in the Measurement and Evaluation are tracked, analyzed and reported.

So we need to ask ourselves, what are the KPIs for the project, program or process we are measuring? What points of data need to be captured, analyzed and reported to determine success?

A successful analyst is able to remove the noise when analyzing data and isolate what matters most to his or her organization. That is what is at the heart of measurement, knowing what data is important and what is not.

Once we have the right data, we can measure what the data tells us to determine success, causality, impact… whatever the outcome may be.

A quote often attributed to management guru Peter Drucker perfectly sums up why big corporations rely so heavily on analytics when he said “What gets measured, gets managed.”

Similarly, policy decisions can be made based on what is measured. Project funding can be impacted by what is measured. Process optimization can be directed by what is measured.

Once we are able to measure what is truly important to policy-makers, managers and decision-makers, we need to make sure we present the data in a compelling way.

This is where data visualization comes in.

I often make the analogy that if a picture is worth a thousand words, then a good pie chart is worth a thousand rows of data.

We all know that most people learn more by seeing something then by reading or hearing it. Data visualization takes that a step further.

Data visualization is not only important to presenting our insights but also for exploring the data for insights. Most people find it easier to process information when it is in the form of a picture then a collection of data.

Chip & Dan Heath, Authors of Made to Stick, found that, “Data are just summaries of thousands of stories – tell a few of those stories to help make the data meaningful.”

The ability to take all of the data gathered in the measurement phase and use it in the evaluation phase will make a significant difference in the success of the project, program or process you are working on.

According to the Office of Planning, Research and Evaluation, “Program evaluation is a systematic method for collecting, analyzing, and using information to answer questions about projects, policies and programs, particularly about their effectiveness and efficiency”. 5

Data Visualization can be used to paint a picture of a program, project or policy that influences outcomes based on the KPIs. And by appealing to the basic human fascination with stories, a persuasive graph, chart or infographic can make all the difference in the world.

By adopting the business analytics concepts of KPIs and Data Visualization, and applying them to the world of programs, policies and projects, you can find the same level of success I found in the corporate world.

  1. American University, “Certificate in Measurement & Evaluation” http://programs.online.american.edu/online-graduate-certificates/project-monitorin Accessed October 20, 2016
  2. Carly Fiorina Speech from December 6, 2004 http://www.hp.com/hpinfo/execteam/speeches/fiorina/04openworld.html . Accessed October 20, 2016
  3. Simon Thomas, Senior Analytics Consultant for IBM https://youtu.be/Zi8jTbXnamY . Viewed October 20, 2016
  4. Chip & Dan Heath, Authors of Made to Stick, http://heathbrothers.com. Accessed October 20, 2016
  5. OPRE, http://www.acf.hhs.gov/opre/resource/the-program-managers-guide-to-evaluation-second-edition. Accessed October 20, 2016

Analytics Education – Facilitating a mastery of the fundamentals of analytics is what DMAIPH does best. All across the world, companies are scrambling to hire analytics talent to optimize the big data they have in their businesses. We can empower students and their instructors with the knowledge they need to prepare for careers in analytics. Contact DMAIPH now at analytics@dmaiph.com or connect with me directly so we can set a guest lecturer date, On-the-Job Training experience or other analytics education solution specifically tailored to your needs.

Big Data Analytics and Business Intelligence

Enabling Your Business to Make Smarter Decisions

Are you tired of being under constant pressure to make the right number-based decisions for your organization?

Are you too often overwhelmed by an out-of-control flood of numerical information, much of it conflicting and confusing?

Big data is booming ast as organizations devote new technology resources to tapping the terabytes (if not petabytes) of data flowing into their organizations.

Today big Data is flooding into the business both through internal processes and externally via social media.

What does this all mean for business intelligence (BI) users and systems?

With all the attention on advanced analytics for big data, what’s the play for BI?

Integrating advanced analytics for big data with BI systems is an important step toward gaining full return on investment.

Advanced analytics and BI can be highly complementary.

Advanced analytics can provide the deeper, exploratory perspective on the data.

BI systems provide a more structured user experience through there richness in dashboard visualization, reporting, performance management metrics, and more can be vital to making advanced analytics actionable.

Recently on December 6, 2016 I was at Astoria Plaza, Ortigas Center, Pasig City for a dynamic and empowering one-day training on Big Data Analytics and Business Intelligence.

Course Description:

Make smarter business decisions using these powerful data analysis techniques

Information is supposed to make us smarter, but more often than not, it simply overwhelms us.

This program is for you if you feel like you’re drowning in data and unsure which data to use to drive your company initiatives.

The truth is that the amount of data available to help run your business is greater than ever before. To effectively use this information, managers must consider the practical side of big data…what matters to you is how do you grow and build a team to make smarter decisions.

Much of the information out there just discusses the promise of the data deluge. The challenge is not the volume of data but rather the judgment needed to use it.

This seminar goes beyond the qualitative side of data analysis to explore proven quantitative techniques and technologies for identifying, inventorying and integrating data, so that more informed and reliable business decisions can be made.

Learning Objectives


  • Apply Best Techniques and Cutting Edge Technologies to Organize, Interpret, and Summarize Quantitative Data
  • Create a Process to Analyze Data and Identify Patterns Not Apparent at First Glance
  • Reduce “Analysis Paralysis” and Go from Hard Data to Well-Reasoned Conclusions in Less Time

What Was Learned

  • Specific skills to effectively frame the problem you’re addressing to uncover key opportunities and drive growth
  • Critical marketing steps of orientation necessary before engaging tools and technology
  • How to simply and quickly amplify decision making by separating the signal from the noise
  • A framework for asking the right questions, allowing the ability to link analytics to business strategy

What Was Covered

  • Using data and statistics effectively in business today
  • Improper data manipulations and their consequences
  • Exploring quantitative data collection methods
  • Improving analysis success by effectively utilizing software
  • Understanding regression, trend lines, and scenarios in Excel
  • Utilizing the power of business intelligence software
  • Finding and analyzing data patterns, trends, and fluctuations
  • Interpreting and translating data into decisions

Who Attended

Over 80 business professionals who needed to learn more about the basic tools to quantitatively and accurately analyze the mountains of data that come across their desk each minute of every day.

Section One

Big Data—It’s Not Just Size

  • Describe the Importance of Effectively Analyzing Big Data in Business Today
  • Come up with a Data Map to Analyze the Big Data in your business.
  • Establish Clear Objectives When Analyzing Big Data
  • Recognize and Apply Various Data Collection Methods
  • Identify and Resolve Problems Associated with Data Collection
  • Discuss the difference between Data Warehouses and Data Lakes
  • Determine when to use Data Blending in your analysis

Section Two

Analysis—Using Business Intelligence Tools

  • Assess Your Current Analytics Culture
  • Describe the Issues and Trends in Today’s Analytics Field
  • Optimize your use of MS Excel for Big Data analytics
  • Discuss the concept of Data Visualization
  • Utilize BI Tools like Tableau Public
  • Build a Business Dashboard Prototype

Section Three

Interpretation—Assessing Results

  • Articulate the Importance of Accurately Interpreting Data
  • Determine and Analyze Risk, Uncertainty, and Probability
  • Spot Patterns, Trends, and Fluctuations Through Correlation, Regression, and Descriptive Statistics
  • Understand when to employ Descriptive, Predictive or Prescriptive Analytics
  • Build Data Models

Section Four

The Art of Presenting Big Data

  • Apply a Process to Present Big Data Clearly
  • Select the Appropriate Presentation Format to Communicate Your Findings Effectively to Your Audience
  • Master the Power of Enchantment
  • Use Findings from Big Data to Drive Decisions Within Your Organization

Too often people dive into the data only to be lost in haze of data.

This discussion will be pragmatic and immediately applicable to analysts, professional using analytics and managers of analysts across all industries.

Analytics Training – DMAIPH in partnership with Ariva Events Management, offers a wide range of analytics centric training solutions for professionals and students via public, in-house, on-site, and academic settings. We tailor each training event to meet the unique needs of the audience. If you need empowerment and skills enhancement to optimize the use of analytics in your organization, we are here to help. Contact DMAIPH now at analytics@dmaiph.com or connect with me directly to set up a free consultation on which of our DMAIPH analytics training solutions is best for you.

DMAIPH Quick Data Survey

A few months back I sent a quick survey to 3,000 of my LinkedIn connections who are either analysts or work closely with data and analysis.

Here is the question I asked.

Greetings!  I’m hoping you can help me gather some data for a book I’m working on. If you had to breakdown the work you do into 3 buckets; finding data, analyzing data and reporting data, what would the % of each be? A quick reply with your breakdown would be hugely helpful in my research. Thanks!   Dan Meyer, Analytics Champion, www.dmaiph.com

I got back over 400 replies.

Here is how they broke down.


% Finding Analyzing Reporting
10 12% 6% 33%
20 14% 10% 39%
30 20% 31% 24%
40 6% 14% 2%
50 31% 16% 2%
60 14% 18% 0
70 0% 0% 0
80 0% 2% 0
90 0% 0 0
100 0% 0 0
       

The higher the %, the more each analyst spent time doing that particular phase of analytics.

Here are some of my takeaways from this simple (and very nonscientific survey)

  • I was surprised to see 45% spend half their time or more on finding data. To me this is one of the telling signs that Big Data has led to a shortage of top analytics talent.
  • Only 1 out of 4 analysts are spending 20% of less of their time finding data. These are generally senior analysts, well established in their company.
  • Only half of my analyst connections are spending 40% of more of their time on conducting analysis. With significant time spent on finding and/or reporting data you can imagine a lot of important discoveries are being missed and opportunities lost.
  • Only 1 out of 3 analysts are getting spend my recommended 50% or more of their time actually doing analysis work.
  • Based on my survey, reporting gets shortchanged a lot. All in, 96% of respondents spend 30% of their time of less on reporting.
  • My recommendation is that you spend about 30-40% of your time on the reporting aspect, and sadly only 4% of my analytics connections are able to do that.

In an ideal world, I would expect an analyst to spend no more the 30% of their time on finding data, and at least 30% on reporting their findings, leaving more or less 40% to do the actual analysis.

IMG_1310

This breakdown is based on my own experience as an analyst as well as seeing how analyst working for data-driven companies work.

Only about 30% of my 400+ analytics focused LinkedIn connections come close to meeting my recommended breakdowns.

Which means I have a lot of work to do.

Analytics Survey – DMAIPH conducts quarterly analytics surveys to collect data on current trends in analytics. We specialize in surveys that assess analytics culture and measuring how aligned an organization is to using data and analytics  in its decision-making. Contact DMAIPH now at analytics@dmaiph.com or connect with me directly to find out more about how DMAIPH can conduct surveys to help you assess the analytics culture in your business.


3 Tips to Maximize the Potential in Your Data

Data is the lifeblood of the 21st Century business.

If you aren’t using your business data to optimize your processes, increase your profits and fuel your decision-making, then you are behind the times.

So let me give you 3 tips to maximize the potential in your business data.

Tip #1 – Map Out Your Data Environment

Tip #2 – Identify Your Data Geeks

Tip #3 – Get On the Same Page

Most businesses don’t have a good map of how their data flows through their business. Just about every employee, every team and every location is stock full of data that can be useful. But, in most businesses there is little understanding of how it is all connected.

You need to know how data is acquired, how it is stored, and how it is accessed. How often is it refreshed? How clean is it? How valid is it? If you have answers to these questions you can build a map of your business data. Like a flowchart.

As you map out the flow of data in your business, you can also identify the data geeks in your business. The ones who understand the value of using data to make decisions. The curious ones who ask a lot of questions. You need to empower these people.

Once you have a data map and you have brought together your data geeks, then you need to get them all on the same a page.

I’d suggest bringing in a consultant who can give you a new and unbiased perspective on how to deal with analytics roadblocks. Places, processes and people in the business who aren’t in synch.

IMG_6912

Another option would be to send the team to a training class facilitated by an expert… someone like me.

If you need a place for your team of data geeks to get outside the box an get on the same page, I will be facilitating a training class on February 21 in Ortigas.  Send us an email @ analytics@dmaiph.com to sign up or request more details. 

I will help you come up with a analytics action plan to help you start taking advantage of the business data you have in order to increase efficiency and grow profits.

Analytics Training – DMAIPH offers a wide range of analytics centric training solutions for professionals and students via public, in-house, on-site, and academic settings. We tailor each training event to meet the unique needs of the audience. If you need empowerment and skills enhancement to optimize the use of analytics in your organization, we are here to help. Contact DMAIPH now at analytics@dmaiph.com or connect with me directly to set up a free consultation on which of our DMAIPH analytics training solutions is best for you.

Unlock the Power in Your Data Using Analytics – All Attendees Get A Copy of My Book!

E-mail us at analytics@dmaiph.com to register for the training or to request more information! 

By now just about everyone knows that there is almost limitless opportunity buried in their business data. The big question facing business analysts, leaders, managers, and owners is how do I unlock that potential.

For a lot of us, we just aren’t sure where to start.

Do we go out and hire an expert analyst or data scientist and hope they can make it all work out?

Do we buy a new business intelligence or data modeling software and hope our current team can figure it out?

Do we send our people to training so they can learn new ways to identify, inventory and integrate business data into our decision-making processes?

Well, successful companies do all three. They line up the talent, technology and technique to empower the business with solid analytics.

Hiring a new employee or brining in a consultant will help you address the lack of talent you have working with your business data. Curious people, adept at working with technology and being able to translate your business questions in to valuable insights is generally step one.

As you bring that new person into the fold though, it is just as important to make sure your team is ready to start using more data in their business processes. You can’t expect one person to fix it all, you need to open up your business culture to embrace more data-driven decision-making.

Once you have the talent in place then I suggest you focus on technique.

Invest in some training to get everyone on the same page. If you have a technological solution in mind, then have them trained on that too. So much time is lost because people tasked with analytics are under trained.

Then, when you have everything lined up. That’s when you spend on a software solution. New tools for data acquisition, storage, analysis and reporting generally fail if you don’t have the talent and technique in place first.

If you still aren’t sure how to get started, I will be facilitating a training class on February 21, 2017 at Discovery Suites in Ortigas.

I will help you come up with a analytics action plan to help you start taking advantage of the business data you have in order to increase efficiency and grow profits.

img_7737

Analytics Training – DMAIPH offers a wide range of analytics centric training solutions for professionals and students via public, in-house, on-site, and academic settings. We tailor each training event to meet the unique needs of the audience. If you need empowerment and skills enhancement to optimize the use of analytics in your organization, we are here to help. Contact DMAIPH now at analytics@dmaiph.com or connect with me directly to set up a free consultation on which of our DMAIPH analytics training solutions is best for you.

Measurement and Evaluation: Analytics and Data Driven Decision Making

Recently Worked on a paper for a school… interesting topic…Measurement and Evaluation Analytics and Data Driven Decision Making.

I will also be doing a related webinar this coming Feb 15 entitled Analytics & Data-Driven Decision-Making.

Webinar details:

February 15, 2017

1pm Eastern

Webpage with webinar registration links: http://programs.online.american.edu/msme/webinars

The ability to effectively evaluate projects, programs and processes requires a thorough understanding of analytics.

Analytics is generally defined as the discovery of patterns in data that provides insight and identifies opportunities.

Organizations that invest in analytics generally make much better business decisions then one’s that don’t.

In fact, IBM found that organizations who use analytics are up to 10x more efficient and 33% more profitable the ones who don’t.

A good analytics solution constructs a universal framework for collecting, analyzing and using data to determine project effectiveness and efficiency.

IMG_6912

As the amount of data available increases daily, the use of analytics is becoming essential to all levels of an organizational today.

This Big Data allows both deeper analysis but also requires more skill in getting to the right data.

By taking inspiration from the way corporations use business analytics to optimize their Big Data, our program measurement and evaluation processes can be greatly enhanced.

Bringing data together from a variety of sources and integrating the data into the decision-making processes, allows the empowerment of decision-makers to make much more intelligent choices.

When analytics driven leaders possess the practical assessment skills needed to evaluate projects bridging various sectors and industries, they are much more effective then ones that don’t.

In today’s information age, the quick and efficient measurement and evaluation of projects using analytics ensures success with corporate, non-profit and governmental organizations across various sectors and industries.

Analytics Education – Facilitating a mastery of the fundamentals of analytics is what DMAIPH does best. All across the world, companies are scrambling to hire analytics talent to optimize the big data they have in their businesses. We can empower students and their instructors with the knowledge they need to prepare for careers in analytics. Contact DMAIPH now at analytics@dmaiph.com or connect with me directly so we can set a guest lecturer date, On-the-Job Training experience or other analytics education solution specifically tailored to your needs.

The Cost of Ambition

Saw this on LinkedIn.

12072713_10153642898230960_3950187338533854727_n

It’s hard to put a price tag on it, but let’s put some data behind the Cost of Ambition anyway.

I worked a corporate 9 to 5 job for 15 years and I rarely just worked 40 hours a week. And for a significant % of the time I worked on things that didn’t always interest of challenge me.

Now I work 24/7 but it is very unstructured. And I am almost always working on things that are both interesting and challenging.

I no longer dread waking up. In fact I am generally full of energy right out of bed.

Before I couldn’t always take time off when I wanted to because it was someone else’s choice. Now It’s always my choice when to take time off.

More time to do what I want to do… cost benefit is a plus.

I have a combined 20,000+ connections on Linked, Facebook and Twitter. I have many, many friends. But I only spend significant time with a handful of them.

Big network, cost is a plus again.

I do indeed spend more time explaining myself then I used to. Being an analyst for Wells Fargo kind of speaks for itself. Being a entrepreneur who set up a business in the Philippines to empower people to use more data and analytics take a few more words to explain.

Often many more words. That’s a cost benefit as well. I can make more money because I can do more things.

As I evolve as a businessman and a professional analytics champion, I do spend more time alone.

The air is definitely thinner on top where the higher you go, the fewer you really relate too.

That might be perceived as a negative cost to many, but to me I’ll add it as plus too.

It takes a certain kind of person to do what I have done. I’ve been told I have moxie. That I am bold. I do not fear much and I enjoy jumping into the deep end of the pool.

As my acquaintances grow, so does my competition.

It is important to look for collaborators while at the same time get used to being burned by failed partnership.

There is definitely a negative cost financially, but I learned a lot of good lessons. So this cost is wash.

I do sometimes feel alone. But more often than not I’m too busy to notice.

Ambition does indeed have its costs. More of somethings, less of others.

But when I add up what my choices have cost me, they pale in comparison to what my choices have brought me.

Success, satisfaction and knowing that if I die tomorrow, I truly did make the world a better place.

And that is priceless.

My Analytics Story – My passion is solving problems by bringing together the best talent, cutting edge technology and tried and true methodologies. DMAIPH is all about empowering people towards better Decision-Making through the use Analytics and business Intelligence. This is what I do best. Contact DMAIPH now at analytics@dmaiph.com or connect with me directly for a free consultation about getting more analytics into your career and your business. 

Creative Ways to Access Big Data Talent

http://www.forbes.com/sites/bernardmarr/2016/09/16/5-creative-ways-to-access-big-data-talent/#6baf4eec580c

Came across this blog post and thought I worth sharing and talking about.

“Demand for big data expertise is growing every day, as more and more companies become aware of the benefits of collecting and analyzing data.”

Just take a look at jobs boards now and from postings a year ago. You can see the number of jobs with analyst or data scientist in them grow like crazy.

“Unfortunately, the number of people trained to analyze this data isn’t growing in line with the demand.”

It shouldn’t be too hard to start guessing at the total number of data geeks needed in today’s global economy. For the sake of argument, if you figure every company with at least 100 employees needs someone to handle internal analytics and every company with at least 1000 customers’ needs someone to handle external analytics… it’s a mindboggling number.

“This creates a challenge for companies looking to hire expert people, especially for smaller firms less able to compete on salary and benefits.”

Not only can big companies invest in top analytics talent, they can also use business Intelligence tools, AI and machine learning to automate data jobs. Smaller companies are not only competing for talent, they are up against huge technology hurdles as well.

“The good news is that, even if you’re having trouble recruiting data scientists because of stiff competition, or if you simply haven’t got the budget to recruit, you can still access big data skills.”

And that is what I agree with 100%. You have to get creative. Going outside to hire someone to come in and manage your data and analytics, to be a data scientist, you are forgetting one key thing. To make use of all the technology out there and to be able to really get value out of analytics techniques, you need to understand the needs of the business.

dr-data_standing-avatar-copy2

In the end, what makes a business analyst, data scientist or big data expert successful has nothing to do with how well they can code, build models or blend data. It has to do first and foremost with can they understand the business in ways to put their big brains to work to solve problems and answer questions relevant to the business.

That is the dilemma. You need people on the inside who know the business, but you can’t get a data super hero to come work for you.

To that end here are my 5 ways to get the most out of your data talent without going outside to hire.

  1. Promote and empower your own data geeks.
  2. Send your team outside to get training from a pro.
  3. Bring in an expert as a consultant and mentor your team.
  4. Get intern/OJT help from local colleges to bring in new perspectives.
  5. Outsource some of your data initiatives to experts and learn from them.

With each of these options, there are significant challenges. As I said before, the best solutions is finding someone with business acumen that pertains to your business.

I will go into more detail with each of these options over the next few blog posts.


++++++++++++++++++++


Promote Your Own Data Geeks


+++++++++++++++++++


Get Trained By the Analytics Pros


++++++++++++++++++


Find Your Team A Mentor


+++++++++++++++++++


Infuse Your Business with Fresh Analytics Talent


+++++++++++++++++++


Outsourcing Analytics To Experts Is Not A One Way Street