Data analytics is a powerful tool that allows us to extract valuable insights from vast amounts of data. Whether you’re a beginner or looking to enhance your skills, this simple how-to guide will help you navigate the world of data analytics. By following these steps, you’ll be well on your way to unlocking the potential of data and making informed decisions.

Step 1: Define Your Objective
Start by clearly defining your objective. What question or problem are you trying to address? By having a clear goal in mind, you can focus your efforts and select the right data and analytical techniques to achieve your desired outcome.
Step 2: Gather Relevant Data
Identify and gather the relevant data for your analysis. This may involve collecting data from various sources, such as databases, spreadsheets, or online platforms. Ensure that the data you collect is accurate, complete, and aligned with your objective.
Step 3: Clean and Prepare Your Data
Data cleaning and preparation are crucial steps in the data analytics process. Remove any duplicates, handle missing values, and correct errors or inconsistencies in the data. Additionally, transform the data into a format suitable for analysis, such as structured tables or organized datasets.
Step 4: Choose the Right Analytical Techniques
Select the appropriate analytical techniques based on your objective and the nature of your data. This may include descriptive analytics (summarizing and visualizing data), diagnostic analytics (exploring relationships and patterns), predictive analytics (making forecasts or predictions), or prescriptive analytics (providing recommendations or decision support).
Step 5: Apply the Chosen Techniques
Apply the selected analytical techniques to your prepared data. Utilize software or programming languages specifically designed for data analytics, such as Python or R. Explore the data, perform calculations, run statistical analyses, and generate visualizations to uncover insights and patterns.
Step 6: Interpret and Communicate Your Findings
Interpret the results of your analysis and extract meaningful insights. What do the patterns and trends in the data tell you? Communicate your findings in a clear and concise manner, using visualizations, charts, or reports to present the information effectively. Tailor your communication to the intended audience, whether they are technical or non-technical stakeholders.
Step 7: Take Action and Iterate
Based on the insights gained from your analysis, take action and make informed decisions. Monitor the outcomes of your decisions and evaluate their impact. Iterate and refine your analysis as needed, incorporating new data or adjusting your techniques to improve accuracy and effectiveness.
Data analytics is a valuable skill that empowers individuals and organizations to harness the power of data. By following this beginner’s guide, you can embark on your data analytics journey with confidence. With practice and continuous learning, you’ll unlock the potential of data and make data-driven decisions that drive success and innovation.
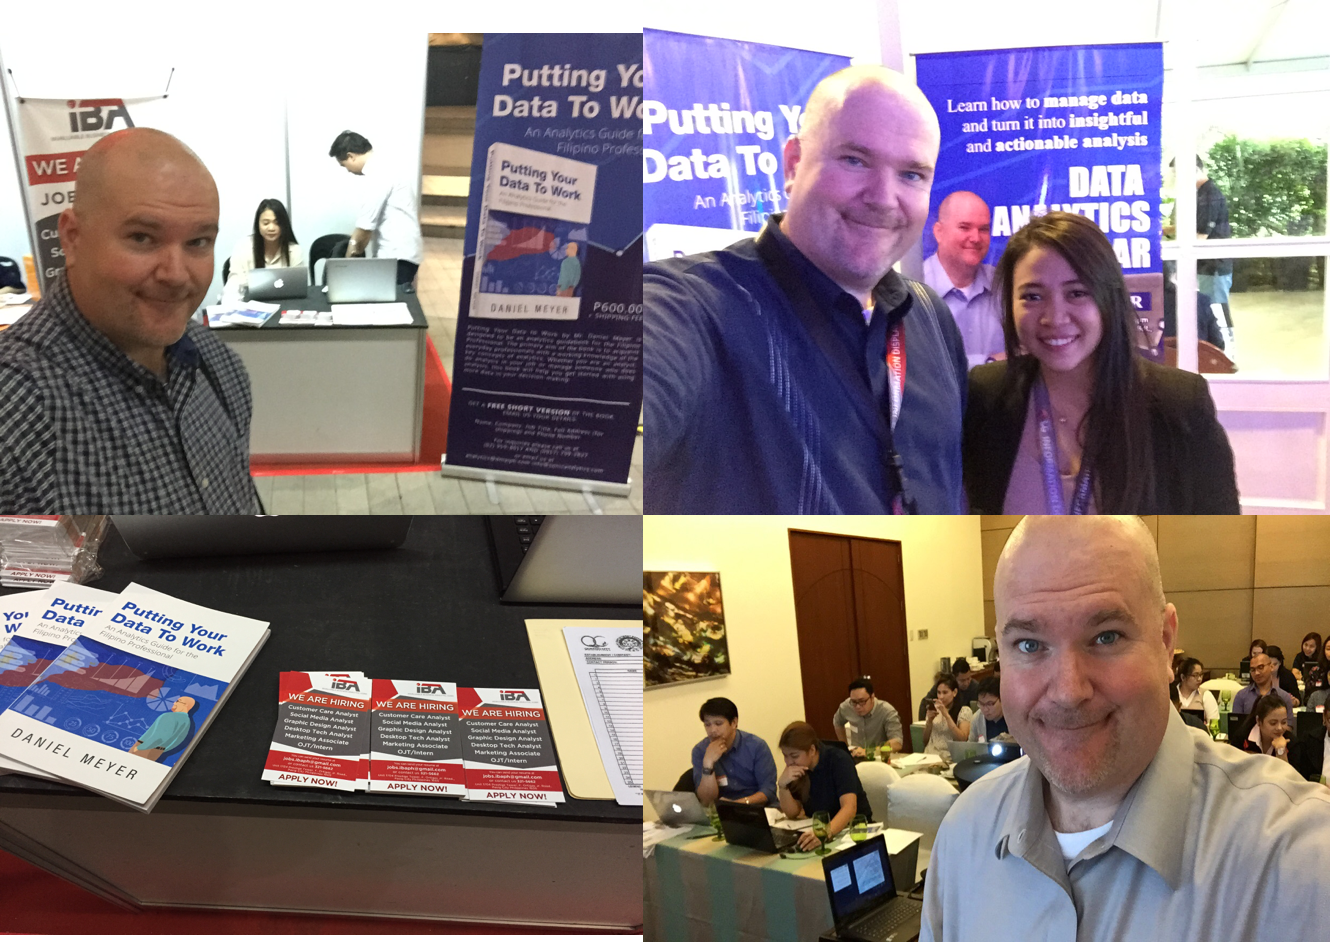
Get ahead of the competition by learning from one of the best in the industry. Book Daniel Meyer for a speaking engagement in your company and start improving your data analytics skills now.
Daniel Meyer is the head of Sonic Analytics, an analytics firm that has been in the Big Data industry for over 20 years and has offices in Manila, the San Francisco Bay Area, and Ocala, Florida. He is an accomplished author, public speaker, and business expert specializing in virtual staffing and process automation.
Dan is known for providing big data analytics solutions, including business intelligence and data storytelling, to small businesses seeking to improve their use of data, virtual staffing, and technology. He strongly believes in using analytics for civic responsibility, and offers training, consulting, and education to promote this advocacy.
With his experience in training over 10,000 Filipinos, Dan is passionate about empowering the youth with valuable skills, such as graphic design, video editing, and data analytics. His objective is to equip them with the necessary abilities to harness the dynamic employment opportunities that lay ahead for millions of Filipinos.


 In my experience, most recruitment teams have good talent in place, and many have the technology they need to be successful. The missing element is often technique. Few recruitment teams are truly skilled in using analytics to get the right candidates, one’s who will stick around, at the right time.