Chief Data Officer – The Data Geek in the Room

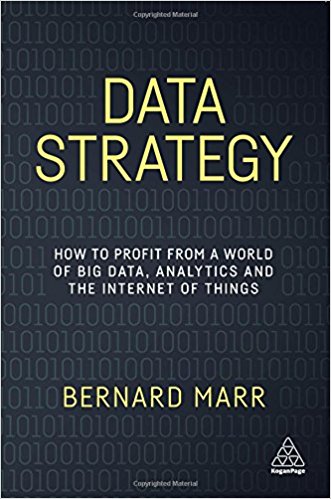
In his latest book Data Strategy, analytics guru Bernard Marr, discusses how to profit from a world of big data, analytics and the internet of things. Marr breaks down the importance of having a data strategy to ensure data-driven decision-making, improve business operations and to monetize the data in a business.

data strategy

One of the key takeaways from his book is the emerging role of Chief Data Officer. This is a separate C-Level Suite position form the more traditional Chief Technology Officer or Chief Information Officer as this person should serve as both an analytics cheerleader and data-driven decision-making champion.

Big companies have CDOs, but even smaller and medium sized companies need to have someone who acts in this role even if its not an official title. I often say that analysts have to not only analyze data, but be champions of using data for decision-making. They have to be the data cheerleaders to educate, enable, and empower the use of data and analytics across the organization.

There are six primary areas a CDO should oversee; (1) high level vision, (2) implementations, (3) data governance, (4) business opportunities, (5) data culture leader and (6) sees data as a commodity.

  1. CDOs have to have either a seat at the C-Suite table or the ear of the top decision-maker in the company. They are the ones who make sure that data is properly channeled to the right people at the right time to ensure data-driven strategies.
  2. CDOs have to be the one ultimately responsible for data project implementations. This is not an IT thing. IT should be involved, but not the owners of data and analytics.
  3. CDO’s have to make sure good data governance is followed. Data has to be stored, secure and accurate.
  4. CDO’s are the ones who have the task of discovering business opportunities and identifying risks. They should have access to all the data they need to do both.
  5. CDO’s are the ones who consistently and clearly articulate the importance of data and the value of data-driven decision-making.
  6. CDO’s see data for its monetary value. Data is a commodity that in itself can be used to not just help the company, but to generate revenue itself.

So if you have a Chief Data Officer, or just a chief data geek, you are on the right path. If you don’t have one of these in your organization then your organization are likely going to be left behind.

may 17-18Analytics Culture – The key to using analytics in a business is like a secret sauce that fuels Data-Driven Decison-Making. It is a unique combination of analytics talent, technology and technique that are brought together to enrich and empower an organization. A successful analytics culture is not easy to create, but DMAIPH can show you how. Contact DMAIPH now at analytics@dmaiph.com or connect with me directly so we can build a strategic plan to turn your company into analytics driven success story.

Advertisement

Intelligence Gathering and Process Training in Manila

Another search term that someone used and ended up on my blog… wonder what specifically there are looking for.

I love intelligence gathering work myself. When I was at Wells Fargo one of my primary duties was to gather intelligence on others money transfer companies that compete with the bank for remittance market share.

img_8168

I was really, really good at it and had a lot of fun doing it. I’ve used that passion to help several clients since then.

Helping them look outside their business to start incorporating competitive intelligence into their analytics process.

To the best of my knowledge, no one has put together an Intelligence Gathering Process training for companies in the Philippines.

It sounds like something that would be really interesting to do.

Survey time to see how much interest I can generate.

Analytics in the Philippines – The Philippines is at the center of the action when it comes to solutions to the global need for analytics. Blessed with a solid foundation of young, educated and English speaking workforce, companies around the world are look for Filipino analytics talent to fill analytics positions. DMAIPH was set up to facilitate these solutions and bring the talent and the business together. And that is exactly why I wrote Putting Your Data to Work, the first analytics guidebook designed specifically for the Philippines. Contact DMAIPH now at analytics@dmaiph.com or connect with me directly so we can help you take advantage of this unique global opportunity.

Why Analytics Projects Fail – #10: Key People Leave

One of the toughest analytics challenges to fix is when key people leave. This reason is another people problem, but with a technology bent. Depending on the importance of the person(s) who leaves, you can experience anything from a minor hiccup to a total meltdown of your project.

One example of this is when the one who built the database leaves. Often they take their unique knowledge of the data structure with them.  Another example is when the systems architect who knows the ins and outs of where the data flows departs. This can make it difficult to track down errors and bugs. Lastly,  the database admin who wrote the code might be the one who quits, taking with them all their coding work. I can even be worse if they leave on bad terms and take a key piece of your development work with them or even destroy it.

In general, the best outcome you can hope for is to is build workarounds that allow you to keep the project going, however sometimes you are better off just starting over or worst case you just live with what you have. So step one is seeing where you are in the process and then determining what it would take to replace that person.

If you are able to continue, then you need to start doing a better job of documenting and making sure information is shared so this won’t happen again. I learned this lesson early in my career. Learn all you can about all aspects of the data environment and document them. A lot of times a clear understanding and documentation will be required by management to assure funding and resources.

4.6

If you have to stop the project until you can find a replacement, then you should also learn, document and share everything so that the new person can pick things up as soon as possible.

In this case, the new person will likely be dependent on you to learn the ropes so use that opportunity to change your culture to be more open.

A final point to add, make sure you understand why the person left.

If there are things you can do to make sure the same thing does not happen again then it is on you to do just that. If it is a cultural thing, then you can be a catalyst for change. If its a compensation thing, then you can help define the expected scope of work and help in the compensation planning. If they left because of a personality conflict, then you can help find someone who will fit in better. Analysts have so much power to shape conversations. Use it.

Analytics Culture – The key to using analytics in a business is like a secret sauce that fuels Data-Driven Decison-Making. It is a unique combination of analytics talent, technology and technique that are brought together to enrich and empower an organization.

A successful analytics culture is not easy to create, but DMAIPH can show you how. Contact DMAIPH now at analytics@dmaiph.com or connect with me directly so we can build a strategic plan to turn your company into analytics driven success story.

Why Analytics Projects Fail: #2 – Lack of Vision

Lack of vision often accompanies lack of focus when good analytics projects come up short or even fail.

The end product produced by the hard work being put into the analytics project has to be championed from top down. If the top dog is not talking about your project and pushing the merits of its implementation, they people will fight getting on board. Their focus will go astray.

Lack of vision is most often caused by a rush to implement a new analytics tool or a need to quickly upgrade reporting. A good analytics solution needs clearly thought out goals and buy in from all stakeholders.

Vision comes from being on the same page. A good project manager can control the vision message and repeat it like a broken record at every project message. An analyst gifted with good communication skills can keep sharing the vision to remind everyone of the benefits at the end of the project. It takes people dedicated to the project to keep it moving.

Vision can be handled like a marketing campaign. A catchy project name, an engaging tagline, a central theme accompanying communications and updates can all keep people focused on the end goal.

If your project is floundering because of lack of vision, then you need to channel your inner cheerleader. It often takes an analytics champion to produce the a positive outcome. And if you are reading this blog, that champion is probably you.

Nothing helps get a vision across better than good visuals… what does the end state look like for everyone involved. Find ways to motivate them with posters, with slogans, with dashboards, with free food. Just keep reminding them where we are going and how awesome it will be when we get there.


Lack of vision can also be an issue when an analytics projects are not well planned out. Maybe the scope was too narrow or too broad or perhaps the technology we are using is obsolete.

Vision is a glimpse of what the future may look like. If I can’t conceptualize why we are doing what we are doing for this project, then we can’t very well share the vision we are supposed to be seeing.

img_7736

My final thought on dealing with lack of vision, is that no one will be better at fixing this then you. As a data person, you have to be bold in your use of data to push the vision and you have to be brave in taking the lead on sharing the vision as much as possible.

Analytics should be accessible across your organization.  If you are in a situation where your analytics efforts are being stymied by lack of vision, connect with me and I’ll help you get things straightened out.

Analytics Culture – The key to using analytics in a business is like a secret sauce that fuels Data-Driven Decison-Making. It is a unique combination of analytics talent, technology and technique that are brought together to enrich and empower an organization. A successful analytics culture is not easy to create, but DMAIPH can show you how. Contact DMAIPH now at analytics@dmaiph.com or connect with me directly so we can build a strategic plan to turn your company into analytics driven success story.

The Five Stages of HR & Recruitment Analytics

I’ve seen a couple of articles recently espousing a set number of stages  in HR and/or Recruitment Analytics. Based on my knowledge, the 5 stages of analytics a people-centric department can experience are the following:

Stage 1 – The Data Dark Age – No analytics at all. Pipelines are either in MS Excel, a very old proprietary data based or maybe even on paper. Nothing is really analyzed, data quality is bad, and reports are pretty useless. Not collaboration exists between HR, Recruitment and other business lines.

Stage 2 – Living in Data Castles – Only a few people use analytics and most key management decisions are not made based on data, but on experience. Every department has data stored within its own data base. Its nearly impossible to share data due to poor data architecture. HR data is incomplete and the recruitment process does not have any dynamic reporting.

Stage 3 – The Flat Data Organization – Some people use some analytics to make some decisions, but its generally inconsistent across the organization. Data is generally historical and used tactically to understand simple patterns and effects. Some of the data castles have evolved to data explorers, venturing out to find and use new data sources, but many castles still remain in the organization. Generally HR and Recrutiment are using a people management and/or recruitment management software. Reports are useful and drive some decisions by management, but there is major room for improvement. Some data leads to buried treasure, but some leads you off the map… data quality is inconsistent.

Stage 4 – Civilized Data Flow – Most decision makers have access and generally use analytics. Several key team members have strong analyst backgrounds. Data is easily shared between teams. Most managers look at data before making a decision, and analysts have a say in business strategy based on their analysis. People are empowered to do their own discovery and analysis. The organization has answers  to questions about recruitment efforts and HR trends. Waste is controlled with effective people and recruitment management software.  Business dashboards are being used to convey a lot of information.

Stage 5 – Data Nirvana – Every team member from top down knows analytics, has access to the data they need and are empowered to take action on it. There are minimal hindrances to sharing data. It is hard to find a place like this but, when you do recruitment works like a well-oiled machine,  HR analytics are predictive and driving recruitment efforts. There is never a question management asks, that there is not a data driven explanation to answer with. Business dashboards are interactive and real time. Surprises are minimal and solutions come quick and founded on business data and insight. Open posts are filled quickly and people stick around because there needs are proactively being addressed.

So what phase is your organization in? Where do you want it to be? I can help you assess where you are and we can design steps to get your where you want to go.

11756770_934770113231654_1677809504_o


HR & Recruitment Analytics – The recruitment and retention of top talent is the biggest challenge facing just about every organization. DMAIPH is a leading expert in empowering HR & Recruitment teams with analytics techniques to optimize their talent acquisition and management processes.

Contact DMAIPH now at analytics@dmaiph.com or connect with me directly to learn how to get more analytics in your HR & Recruitment process so you can rise to the top in the ever quickening demand for top talent.

To Strive For Operational Excellence

Analytics is key for any organization to be able to strive for operational excellence and succeed.

https://www.linkedin.com/pulse/operational-excellence-manifesto-joseph-paris

Came across this blog post on LinkedIn talking about operational excellence. The author provided 5 pieces in the flow of a continual cycle of operational excellence:

  1. Strategic Clarity – Clarify the business model and sources of competitive advantage for each business line
  2. Culture of Excellence – Instill a philosophy of relentless passion for operational improvement
  3. Advantaged Architecture & Process – Design operational architecture, processes and production system to create competitive advantage
  4. Well-Orchestrated Journey – Disaggregate journey into a sequence of digestible pieces driven by real change leaders
  5. Superior Alignment & Execution – Align organization with objectives and reinforce with superior execution

Looking at how we put these ideas into action, here is what I hope the DMAI team can do.

We can continue to look at each business line to make sure its running optimally. Often we focus our energy just on what’s broken, and rarely focus on what’s working. We lost track of the fact that just because its working, doesn’t mean it’s optimal.

We can demand more from people. Allowing mediocrity to become the norm is a sure sign we have lost our passion to improve ourselves and our business.

We can document more. We can share the documentation more. We can use the documentation as a living, evolving part of the business that will keep things innovative and forward looking.

We can set tactical goals. We can reward ourselves to celebrate these successes. And we can use these successes to springboard us to the next tactical goal as we string together success after success towards out ultimate strategic goal. Be the name brand in analytics here in the Philippines.

operational excellence

We can constantly promote, motivate and empower each other to strive towards operational excellence and never accept operational mediocrity.

We can all get behind the core values of the company, behind our strategic vision and more in unison in our never ending pursuit of operational excellence.

Analytics is the application of using data and analysis to discover patterns in data. DMAIPH specializes in empowering and enabling leaders, managers, professionals and students with a mastery of analytics fundamentals. Contact DMAIPH now at analytics@dmaiph.com or connect with me directly to find out what we can do to help you acquire the analytics mastery you and your organization need to be successful in today’s data-driven global marketplace.

SWOT > Great Tool For Analysts To Know

One of the reasons I love working with students is often something that is old to me and to many analysts, is actually new to them. SO getting to explain SWOT to students, or in this case having a student share with me their understanding of SWOT is pretty cool.

SWOT can be very helpful in general consulting and also in process optimization projects that many analysts find themselves assigned to.

How the SWOT ANALYSIS helps the business

One of the best way of evaluating a business unit opportunities is conducting the SWOT Analysis. Using a SWOT Analysis in your business, you can provide a necessary tools and information to establish your goals and objectives. And it will measure the progress of the business. The Strengths’ and the Weakness and the Weaknesses will be the inside Factors; the Opportunities and Threats will serve as the exterior factors.

Evaluating the Strengths

Evaluating what does the company do well, does the company has strong sense of purpose and the culture to support that purpose and is the company strong in its market. It could be your marketing expertise, or your excellent customer service. It’s important to try to evaluate your strengths in terms of how they compare to those of your competitors.

Recognize the Weaknesses

Recognizing the weaknesses will aid the decision-making process designed to improve you’re company. Don’t just make a list of mistakes that have been made but instead learned from what happened. Be prepared to hear things you may not like, but which, ultimately, may be extremely helpful. Business weaknesses can include accessibility of product, higher prices than other competitors and poor quality of products and services. By this you can minimize your weaknesses.

Look for the Opportunities

In this section you can identify what are the new opportunities for your business and interesting trends which you can take advantage of.  Example of opportunities includes potential new uses of products or services, social factors and the use of marketing or promotional techniques to market the business.

Be ready for the Threats

Threats to your business can be also as weaknesses and can be adversely affect your business but it can be a short- term circumstances that can be resolved immediately. For external Threat it could be new legislation or a new competitor in your market and for internal threats could include the company’s skill or staff shortage.

analytics_robo_people

Analytics and Process Improvement

Had an interesting text conversation yesterday that I thought worth sharing as it brings up a good question… can you have process improvement without analytics?

I got a text randomly yesterday from a friend who is considering a new job as an analyst for a hospital.

flow

Friend: Hi Dan, I got a question on analytics. If I wanted to increase the utilization of rooms in a hospital, what kind of data should I be looking at?

Me: Do you want a well thought out plan or a quick and dirty answer?

Friend: I suppose quick and dirty.

Me: Length of patient stay. % of special needs patients. Physical dimensions of space to see if space is optimized. Understanding of patient process flow to see where wasted time is. Then put it all together to come up with some current metrics and then track against optimal case metrics.

Friend: What exactly do I need to be looking for if I go look at length of stay? What are optimal case metrics?

Me: To optimize usage, you need to gather data for key metrics as they currently are. And then project the same metrics is everything was working at its most efficient state. Length of stay is a key metric as you need to determine what is causing longer than expected patient stays. This will help you minimalism things causing wasted time. Analytics will identify waste and then you use metrics reporting to manage the waste. Make sense? This sounds like as much a process improvement project as it does analyst work doing some new metrics reporting. It could be a very interesting project with both short-term consulting on the process improvement and long-term need for an analyst to monitor the data via metrics reporting.

Friend: Yeah, you are making lots of sense. So, if I were trying to shorten length of stay, I would look at current length of stay per case. Then look for all the factors impacting length of stay, and then improve the process flow for the ones where its taking too long.

Dan: Something like this is how I would start.

Based on my experience, when you are presented with a business problem and asked to help solve it. It’s almost always an issue of a process that is inefficient or wasteful that is the root cause, but you need plenty of data to identify that. A good analyst is just as much a process improvement guru as they are a reporting expert.

IMG_6912

Analytics Consulting – As a founding member of Gloabl Chamber Manila, DMAIPH specializes in a variety of analytics consulting solutions designed to empower analysts, managers and leaders with the tools needed for more data-driven decision-making.

We have helped dozens of companies in both the U.S. and the Philippines, get more analytics in their business.

Contact DMAIPH now at analytics@dmaiph.com or connect with me directly so we can tailor an analytics solution made just for your unique requirements.

13 Months in the Philippines – Lesson 6 – October 2012 – You Can’t Go Home Again

004Alabang, Metro Manila, Philippines

October was a crazy month. Started out with an office in Taugig. Then spent most of the month in Clark. End the month back in California for vacation. Each story could be its own blog post, but for the sake of moving the narrative along, I’ll just briefly touch on each.

We found this great office space in Taugig. It wasn’t the best location, but good enough. It wasn’t the perfect size, but more than enough for our first year or so. And it was very reasonable as far as price and lease terms. The problem was we weren’t making enough money to cover the cost and my partners felt it to risky to keep the office with the hope that we eventually start making positive revenue. It would have made a great home. I’m still convinced that was a huge mistake because with a dedicated space I could have been running all kinds of trainings and seminars there. Anyway, it’s another simple analytics exercise. Basic accounting is always a foundation of any analytics exercise. Are you brining in enough money to pay the bills?

Going to Clark was a pretty cool experience. I got used to taking the MRT from Makati to QC everyday, I like the drive on the NLEX, and I felt at home in Clark. Being an old American Air Force base in the middle of one of the most beautiful parts of the Philippines, it felt like I was in Florida. Having grown up in a military family and spending most of my childhood summers in Florida… its was like being home again. Getting out into the provinces on a regular basis reaffirmed my belief that the future of the BPO industry is not in Manila. Things didn’t work our with your client, but I made a lot of connections in Clark that will always be worth the lost time on the failed project. One of the key lessons here, understand the amount of effort it takes your workforce, clients and/or customers to travel to get to you. A lot of companies don’t really analyze the market they are set up in, especially when it comes to recruiting talent.

At the end of October we came back to the US for a mini vacation and it was well-timed. BPO Elite was dying, the family needed some comfort time back home and it was just in time to catch the Giants winning the World Series. However, after spending six of the most amazing months of my life in the Philippines, it really didn’t feel like home. Its a lesson I’ve known since I spent a semester of high school in Japan, but home really is where the heart is. And for so many reasons for me that’s no longer the US. It’s the Philippines. You cant go home again, because where ever you are passionate and feeling alive… that’s where home is. And its the hardest part of analytics to understand… because there are no number or datapoints involved.

Analytics Tool > Microsoft Power Point > http://office.microsoft.com/en-us/powerpoint/

Analytics Concept > Process Improvement > http://en.wikipedia.org/wiki/Process_improvement

YouTube Resource > http://youtu.be/Q89qAbAAR3Q

My Analytics Story – My passion is solving problems by bringing together the best talent, cutting edge technology and tried and true methodologies. DMAIPH is all about empowering people towards better Decision-Making through the use Analytics and business Intelligence. This is what I do best. Contact DMAIPH now at analytics@dmaiph.com or connect with me directly for a free consultation about getting more analytics into your career and your business.