Q7: What exactly is data science and why the rapid rise of data scientists?

A year ago I might have found it challenging to really answer this question. The first time I had heard of the term data science and a data scientist wasn’t that long ago. And I have been doing some pretty advanced analytics for close to 20 years now.  I know the term has been around in academic and research circles awhile longer, but 2014 is the first time I ever saw a job posting for data scientist in big business.

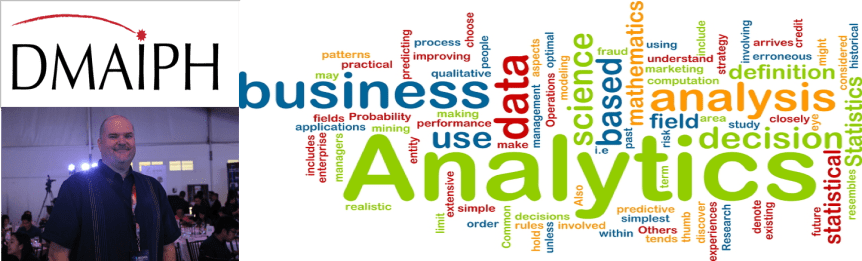
So what is data science? Besides simply being the study of data, it generally refers to using complex models, machine learning, predictive and prescriptive analytics and powerful technology to analyze business data in much greater volume, velocity and variety then possible a few years ago.

And of course the ones charged with doing the data science are data scientists. They understand math, statistics, and theories that can be applied to business data using new technologies and methodologies.

The biggest challenge to being a true data scientist is that you have to be adapt at both technology and working with people. Being a business data expert, knowing how to code and doing higher math are only half the job. You have to also share your data, communicate it in ways that drive action, share and engage with non-data centric people. It’s hard to find people who are good at both.

ByugG_cIEAAL6wM

Image from Forbes Magazine. 

In addition, whole some data scientists are educated to be data scientists, very, very few actually have any kind of degree in data science. That kind of degree really didn’t exist until very recently. Instead most data scientists have advanced degrees is related subjects and have migrated into the business world do to market demand.

That demand has been growing at a staggering rate the past few years as every day we generate more and more data across the planet. President Obama first employed a data scientist for his campaign in 2012. The White House now has a chief data scientist position.

If you were to compare results from job board searches form 2012, you’d see maybe 100 data scientist job postings. Now its easily in the 1000’s.  So that’s why the job market for data scientist is one of the hottest around.  Lack of training programs, having both tech and people skills, and the booming demand due to unending new data to being analyzed.

Some people ask me if I’m a data scientist I am careful with my answer. True data science is not something I am academically prepared for nor I have never published anything in a scholarly journal. But my real world experience working with data has made me an expert on many aspects of data science.

I guess I feel more like an analyst, but a freakin awesome analyst who can do a lot of things using data that are super important to a business.

img_8168

Analytics Education – Facilitating a mastery of the fundamentals of analytics is what DMAIPH does best. As a key parnter of the Data Science Philippines Meetup Group, DMAIPH champions the use of using data. All across the world, companies are scrambling to hire analytics talent to optimize the big data they have in their businesses.

We can empower students and their instructors with the knowledge they need to prepare for careers in analytics. Contact DMAIPH now at analytics@dmaiph.com or connect with me directly so we can set a guest lecturer date, On-the-Job Training experience or other analytics education solution specifically tailored to your needs.

Q6: Can you provide some tips on how to manage data?

So you have the data lake, the messy version of the lake or data swamp and then the pristine, well managed version of the data lake called the data reservoir.

08-data-reservoir-walter-with-hard-hat

Imagine how a reservoir of fresh water is used for multiple purposes… fishing, drinking, watering crops, providing electricity. That’s how your data should be structured. Even if you are working with multiple data sources made up of a lot of unstructured data from social media, you need to be organized with your data.

I’m willing to bet that if you are reading this then you are by nature pretty organized. Analysts tend to be. If you are working in an data swamp and the company culture is not data-driven, the best advice I can give you, no joke, is to find another job.

What to look for in a data-driven company? Are the data warehouses easy to use? Is their documentation on the data architecture? Is there a knowledge base? Are there experts and are they open to helping you?

If you say yes to questions like that, then your data management tasks are generally about optimization, data blending, adding new sources and being a kick ass analyst.

If you say no to questions like that, then your data management tasks are generally about cleaning data, lots of data validation and having your analysis be filled with caveats that you might be missing something.

So a few tips I have for those in good data companies; get your documentation fresh, do a lot of bread crumb dropping, save your queries and models.

Keep the data architects,database admins and/or IT staff in your circle. Share with them how powerful your analysis is because of their help. And most importantly, show you masterly of the data lake.  Tell your story. And teach others how to fish in it.

For those of you not so blessed with good data cultures. You have to start on both ends. Map out the data flow. Try and assess where the data goes bad. Is it the input or capture of the data, is it a loading process, is it filers? Once you get a start on the front end, then go to the back end.

Who needs the data? How much of what data is being provided now is actually usable? Eliminate any unnecessary data. Basically start cleaning up the swamp at the same time you map it. And again tell this story. Don’t make excuses, but you do need to educate. Let people know there is a problem with the data and outline what you will do to correct for it.

In either case, before you go out and request or purchase new tools or start adding new data… make sure you have the architecture figured out. That’s the best tip I can give you about managing data.

jobspicture2

The Fundamental of Business Analytics – Business Analytics is the application of talent, technology and technique on business data for the purpose of extracting insights and discovering opportunities. DMAIPH specializes in empowering organizations, schools, and businesses with a mastery of the fundamentals of business analytics. Contact DMAIPH now at analytics@dmaiph.com or connect with me directly to find out how you can strengthen your business analytics fundamentals.

Q5: What are some basic strategies an analyst can use to find the right data at the right time? – Part 1

Several years ago I came across a book called the Accidental Analyst. After reading the book I was inspired to come up with a way to teach analytics to college students and fresh graduates.

The core of both the book and my program hinges on the ability of an analyst to find the right data at the right time.  The authors suggested that identifying your data is where it all starts. Identifying exactly what you need to address whatever it is that you need to report.

When I am training newbies, I generally brake finding data into two parts… the process of getting the data and the process of making sure the data is valid.

Back at Wells Fargo, the single greatest attribute that I had that made me successful was my ability to size up how long it would take me to deliver something. Knowing what data I would need, where I would find it and how long it would take me to analyze it to come up with something useful made me somewhat of a wizard in the minds of the team.

Finding the right data at the right time requires one to first off know their data. You have to know how the data is captured, where it is stored and how it makes it way to you. Knowing the data architecture in your business is the key.

So you have to get to know the people who know where you data comes from and how it gets there. Learn from them. Partner with them. Buy them doughnuts.

A few months ago I came across an analogy being used to describe data in a business. That of a data lake. A data lake is the living, breathing, evolving pool of all the data in a business. If you have a good data architecture, and you can navigate it fairly easily, then you have a data lake.  Ideally, your business has data structured in such a way you can live off it. Data to a business is like water to living things… it sustains life

07_data-lake-walter-fishing

So once you have the lake mapped out, then you have to learn how to fish it. Knowing where the fish are biting is another key. Once you know what data you need, you have to know how to get to it quickly.

Business Intelligence tools help us here. As does coding languages to extract data from a database. These are your fishing tools. You have to practice using them to be good at getting the right data at the right time.

Another way to optimize your data search is to save your work. Of as I call it leave yourself breadcrumbs. Save the query. Cut and paste the code into a document and save it. Write down the steps. Whatever you need to do to replicate what you just did so you can do it again in the future without starting over from scratch.

So to recap, how to you find the right data at the right time? You know its structure, you understand how its stored and you leave yourself clues to do things faster next time.

Now the other part of the equation is knowing if the data you are using is the right data. Finding data quickly doesn’t do you any good if you bring back the wrong data. We’ll talk about data validation and data quality in a future post.

The Fundamental of Business Analytics – Business Analytics is the application of talent, technology and technique on business data for the purpose of extracting insights and discovering opportunities. DMAIPH specializes in empowering organizations, schools, and businesses with a mastery of the fundamentals of business analytics. Contact DMAIPH now at analytics@dmaiph.com or connect with me directly to find out how you can strengthen your business analytics fundamentals.

Q3: What are some of the current trends in analytics?

Every few months I devote a day to discover what are the current trends in analytics. I do this both to refresh the slides in my presentation and to refresh my mind to see what I may have missed.

The amount of literature out there on analytics continues to blossom at an amazing rate, making it a true challenge to stay well versed on what’s hot and what’s not. I read a new analytics themed book about once a month and I have well over 200 blogs, web sites and social media groups cataloged. So I like to think I’m pretty well versed on what is current.

Every time I go to list the top 5 analytics trends, I find that some things change and some stay the same. Ever since I have been doing this, data visualization is near the top. Business dashboards continue to be a big need. Business intelligence tools evolve and new ones’ pop up, but Tableau continues to be a market leader. 90% of us still use Excel for 90% of our analytics work.

275

Still a lot has changed. When I started this just 5 years ago no one was really talking about Big Data or Data Science. People just stared discussing using predictive analytics and now its all about prescriptive, even though most of us are still just doing descriptive analytics. For the newbie, descriptive = historical, predictive = forecast models, and prescriptive = really complicated models with a lot of variables to not just predict the future but to show a lot of alternatives as well.

Now if you talk to experts they make think nothing I have mentioned so far is new. But to the novice analyst or to the manager who really doesn’t care what’s it called, she just want’s results… its all new to them.

So I try each time to really find something really new not just to me but truly new to analytics. Six months ago that was the idea of using a data lake instead of a data warehouse. For those still unsure what a data warehouse is, it’s a collection of databases stored and/or connected centrally. Data lakes are used to describe the reality that more and more data is now unstructured data.

The discussion on what is unstructured data and how best to mine it and integrate it with structured data has really been at the forefront for a while now. Going from 80% structured to 90% unstructured in in just a few short years as mankind generates unprecedented amounts of data not easily captured in a database every day.

As of today, if I had to pick 5 topics to talk about it would be (1) Hiring Data Science and Analytics Talent, (2) Big Data Analytics, (3) Data Warehousing and Data Lakes, (4) Data Blending and (5) Mining Public Unstructured Data

Check back with me in a few weeks and this list will change.

The Fundamental of Business Analytics – Business Analytics is the application of talent, technology and technique on business data for the purpose of extracting insights and discovering opportunities. DMAIPH specializes in empowering organizations, schools, and businesses with a mastery of the fundamentals of business analytics. Contact DMAIPH now at analytics@dmaiph.com or connect with me directly to find out how you can strengthen your business analytics fundamentals.

Q2: Can you tell us what makes you an Analytics Champion?

Well, the first thing you should know about analytics is that there is no one right way to do things. Analytics is in many ways a new profession and up until very recently few people have seen being an analyst as career path. In fact the majority of analysts became so by accident.

Like in my case, most analyst are drawn to analytics because they like to solve problems, have an affinity for working with data, are tech savvy and above all else… insatiably curious. By the time I first had analyst in my title, I had already been doing analytics for several years.

Right out of college I found my novice skills with Excel, my interest in sharing knowledge and my ability to solve problems leading labeling me the data guy. There is nothing specific in my background that would suggest I’d become an analytics guru someday.

Majored in History with a plan to be a teacher. Obtained my Master’s Degree in Education. Started to teach. The school I was working at went bankrupt. Took a job with Wells Fargo Bank just to pay the bills and 15 years later I had amassed a wide range of analytics skills.

If you ask anyone with analyst in their job title, most of them have similar stories. Until recently you could not even get a degree in analytics as schools are just now offering analytics focused courses and degrees.

In 1998, I had the good fortune of being hired by Wells Fargo. The factors that contributed most to my success with the bank were two things inherit in the culture; its progressive use of data in decision-making and its accepted practice of moving up the corporate ladder by moving between departments.

If I had to pick one thing above all others that had made me a good analyst, it is my ability to quickly assess a problem and then identify the data needed to solve the problem.  For my money, finding the right data is the most important trait to have and also the hardest to teach. It comes out of being curious and letting that curiosity drive you to find answers.

For 15 years that drive lead me to add new skills, learn new technologies, and develop new methods to become a proverbial jack of all trades when it comes to analytics. I often describe myself as a super hero, analytics being my super power and the wide range of skills I’ve picked up being items on my utility belt.

10440851_554583471353767_2228398462482113391_n

I am far from an expert on most of the ever increasing number of analytics tools out there, but I know what they can do and what they are good at. There are definitely a lot of people who are better at different aspects of analytics and no one can know it all. But in the end, I have become in many ways a guru of analytics.

I love talking about analytics, explaining it in layman’s terms, empowering people new to the concept, turning on the light in a dark room. I also love talking about prescriptive analytics models, using SQL code to write a complex join between data tables or figuring out what tool would be best use to build a business dashboard.

Providing people with the fundamentals of analytics is what I have been destined to do.

The Fundamental of Business Analytics – Business Analytics is the application of talent, technology and technique on business data for the purpose of extracting insights and discovering opportunities. DMAIPH specializes in empowering organizations, schools, and businesses with a mastery of the fundamentals of business analytics. Contact DMAIPH now at analytics@dmaiph.com or connect with me directly to find out how you can strengthen your business analytics fundamentals.

Q1: To start can you provide us with a basic overview of what is analytics?

Analytics is simply about looking for patterns in data to help answer questions. Most people use analytics within a business to help ensure more data-driven decision making. Businesses that use analytics are generally much more efficient and much more profitable then ones that don’t.

Analytics is generally employed by analysts who are skilled in using certain technologies and methodologies to identify, inventory and integrate large amounts of data quickly. What separates analytics from statistics and data science is generally the speed of the analysis and the focus on solving business problems.

The most common form of analytics is general business analytics that are used by senior leaders and decision-makers to investigate problems, validate assumptions and to guide strategic planning.  Business analysts are therefore the most common type of analyst. However, analytics can be used in an almost limitless number of business functions in specific areas like HR, recruitment, marketing, finance, and so on.

Analysts have been around a long time, but recent technological advances have both allowed us to produce and capture more data as well as give us the ability to analyze immense data sets quickly. Thus we are amidst a huge boom in the applications of analytics and the need for analytics talent across the globe.

Analytics is something just about every business leader is trying to figure out how to use more effectively in their business. As a result, there is a huge shortage of people who are skilled in working with data to answer questions and solve problems. This why you have seen the number of analyst job postings increasing at an amazing rate.

If you are not actively trying to surround yourself with analysts and if you are not infusing an analytics centric culture in your business, you will most likely soon see your business fail.

The Fundamental of Business Analytics – Business Analytics is the application of talent, technology and technique on business data for the purpose of extrating inights and discovering opportuniites. DMAIPH specializes in empowering organizations, schools,  and busiensses with a mastery of the fundamentals of business analytics.  Contact DMAIPH now at analytics@dmaiph.com or connect with me directly to find out how you can strengthen your business analytics fundamentals.

20 Questions with Dan Meyer about the Fundamentals of Analytics.

Recently I was asked to put together an FAQ about analytics. Based on my experiences from training people how to better use analytics, these 20 questions are the ones I most commonly get asked.

  1. To start can you provide us with a basic overview of what is analytics?
  2. Can you tell us what makes you an analytics guru?
  3. What are some of the current trends in analytics?
  4. Can you please describe the current state of analytics in the Philippines?
  5. What are some basic strategies an analyst can use to find the right data at the right time?
  6. Can you provide some tips on how to manage data?
  7. What exactly is data science and why the rapid rise of data scientists?
  8. Here something a lot of us are wondering, what exactly is big data and how can we use it?
  9. Can you please describe the concepts of storing data in a data ware house?
  10. Please talk about how, when and why we use should descriptive analytics?
  11. Can you next describe how to best use predictive analytics?
  12. Next please explain when and how we can use prescriptive analytics?
  13. A lot of us want to know what is business intelligence and how does it add value to analytics?
  14. What is data visualization and how does it help drive better decision-making?
  15. What is a business dashboard and how is it used in a business?
  16. Can you tell us more about current trends and hot new tools in social media analytics?
  17. Many of us work in recruitment or HR. What are some best practices and technologies used in HR and recruiting?
  18. Can you please talk about recent developments in higher education on how to train more analysts?
  19. How would you describe your approach to teaching analytics?
  20. So in conclusion can you explain a little more about your own method for using data to drive better decision making?

Each day for the next several days, I will take each question and elaborate and share with you my own personal FAQ on the Fundamentals of Analytics.

coverpicture1

The Fundamentals of Business Analytics – Business Analytics is the application of talent, technology and technique on business data for the purpose of extrating inights and discovering opportuniites. DMAIPH specializes in empowering organizations, schools,  and busiensses with a mastery of the fundamentals of business analytics.  Contact DMAIPH now at analytics@dmaiph.com or connect with me directly to find out how you can strengthen your business analytics fundamentals.


The Best Bunch of Analytics Interns Ever

2011 – Year Zero – The Best Bunch of Analytics Interns Ever

So this is simply the story behind one of the coolest things I have ever done.

Earlier in 2011, before I set up BPO Elite, I was chatting with a friend who was attending a local community college. She was trying to find a speaker for a business club she was an officer in. I offered to come in and talk about remittances. It was a lot of fun. After the talk and lots of Q+A, one of the students approached me and asked if we had internships.

Hadn’t really thought of that before, but it made a lot of sense. I had worked with several interns while with Wells, and generally introduced them to how we did analytics. So it was a natural progression.

So I took on the intern and before I knew it I had 5 of his classmates on board as well. As I was putting the business plan for BPO Elite together I came up with a list of things we needed to understand the competitive landscape around the new business.

I divided them up into 3 types of analytics interns based on their interests; business analyst, marketing analyst and data analyst. I gave each one a research topic, gave them in a crash course in Tableau and turned them loose on doing some public data mining and analytics for BPO Elite.

About the same time we got our first two clients. A small shipping company that specialized in shipping things to the Philippines and a local chiropractor. Both business owners were at a point where they needed help understanding some of the reasons why there businesses were not a successful as they thought they should be. They knew they needed help, but didn’t know where to turn . Fortunately I had the answer… they need to bring some analytics into their businesses.

x2.1


So before we go one, let’s level set on what exactly analytics is. In its simplest form it is a the discovery of patterns in data with an eye towards using these discoveries to help a business be successful. If you ask any 10 professionals who work with analytics you will get 10 different answers. It’s a broad topic with just about every business using analytics differently than the next one. And most small businesses don’t even use analytics. Its more in the realm of the corporate world.

So after explaining to my clients what I could do to help them using analytics and getting a good idea of their challenges, I came up with some plans and turned my interns loose.

We did some good in both cases. Mainly focusing on building demographic profiles of their ideal customers and mapping where they lived, we came up with some targeted marketing materials. We used US Cenus data, Google and Tableau to demonstrate the opportunity around them.

We also spent some time building a competitive landscape for each buseiness as well so the clients could see where they stacked up against them. And finally we added some customer insights, mining data from their social media sites and places like Yelp. All in all, we gave each business owner a sample of the things I used to do at Wells. In both cases it was a big help.

And the best part, the kids learned tons of things they wouldn’t likely have learned in a traditional corporate internship. They got their hands dirty with data and they made a difference in the success of a business.

Today, they are all employed in good jobs, mostly working in position with analyst in the title.

Pretty awesome stuff.

My Analytics Story – 2011 – Year Zero – Past as Prologue

This is the first in a series of blog posts to I have planned to share My Analytics Story – Teaching Analytics in the Philippines.

I first got the idea to do analytics training and outsourcing in the Philippines in early 2011.

A little historical perspective first. For most of its history Wells Fargo was not very big into outsourcing, but was very big into analytics. I had been working as a senior analytics consultant with the bank for several years and doing some pretty amazing things with data blending and data visualization for our management team.

Then Wells Fargo acquired Wachoiva and all of a sudden my team was given the challenge to help set up some new positions in the Philippines. Wachovia had a long and successful history with doing back office operations in Manila.

For those not familiar with Wells Fargo and/or Wachovia:

The first team to be set up across the Pacific was a back office, new account fulfillment team. A fairly routine series of tasks, easy to capture and validate data. My role was to provide benchmark data and then management reporting as the transition progressed. While doing this I was paired up with several business partners in Manila. And quickly I discovered that their analytics tools were not very advance and they really didn’t use much predictive analytics.

The light bulb turned on.

I could do this. I could go to the Philippines and get involved with training people to do more analytics, to bring more data-driven decision making to the outsourcing industry!

Given I was married to a Filipina, most of my friends are Filipino-American and I grew up in a city with one of the largest Filipino communities in California, this was a perfect chance to grow my affinity for the Philippines.

And of course I could get back to doing more teaching in the form of training people to use analytics. I had been thinking about getting back to teaching for a while, but the bottom line is Wells just paid better. Plus, I really love working with data. So then next light bulb went off.

I can take what I am good at analytics, and merge it with my passion, teaching and get into the business of training analytics.

As this plan was starting to evolve in my mind, things at work where also coming to a head. I had been trying for a while to find a new job that would get me closer to being involved in both analytics and outsourcing equally with no luck. Lots of interviews within the bank, but nothing came to fruition. Which in hind sight was a total blessing in disguise.

One day I was chatting with a good friend about my growing frustration of not being able to find the right job at Wells and he said, well why don’t you set up your own business then? Light bulb number 3.

But then how? He suggested we talk with a friend of his who was ironically enough looking to set up his own call center in the Philippines. We had several meetings and decided the three of us would set up a new business both in the U.S. to find clients and in the Philippines to train talent to do work for the clients. I came up with the name BPO Elite and the tag line, making data-driven decisions.

And then we got around to talking about who would run the company. And they both immediately said it would have to be me. Up to this point, never in my life had I contemplated such a thing.

Me being the boss.

The final light bulb burned bright. Now it would just a matter of planning the launch of the new business.

31.png

This was around June 2011. We set up BPO Elite legally, built the web site, started doing some marketing.

One thing I needed to validate though was can I actually train people to do the analytics we would be offering as a service. I needed to do a pilot here in the U.S. before moving to the Philippines. I had always thought college students/fresh graduates would be the best ones to hire to work in our business. They are open minded and highly energetic and I could fill their minds with the technologies and methodologies I had used at Wells to be a great analyst.

So thanks I brought on a team of interns over the summer of 2011 with the idea of teaching them analytics and turning them loose on some local small business clients to see if we can drive some results that would be turned into a training model.

It was a huge success. Great pupils. Happy Clients. Lots of Data. More on the how I did it later. For the sake of the narrative, it worked. So it was time to leave Wells Fargo and set in motion the plan to move across the Pacific.

And one more key point I will get to later, one of my parners had a connection at one of the top schools in Manila. So lets not just train fresh grads to do analysts, I should also tie up with the school to teach a class on analytics. More access to talent and a good way to build our brand credibility.

The moral of the story… the reason behind my posts… dream a dream, validate it with data, take calculated risks to seize opportunities and then just persevere.

More to come.

All The Tools And All of The Talent but none of the Technique… Where Good Analytics Intentions Go Bad

I have seen so many examples of this. A majority of companies throw money at analytics in the form of buying new technology, but don’t spend a fraction as much on the people who need to make the technology work.

A good analyst using Excel is much more powerful then a mediocre analyst using a cutting edge BI tool. Without the innate curiosity, knowledge of the business and ability to communicate discoveries that come with a good analyst, your analytics plans will fall short no matter what the sales reps from the analytics companies promise you.

Now we have the 2016 Presidential Election results to analyze. Most predictive models had Clinton winning. Most of the polls had Clinton winning.

So where did the analytics go wrong? Well, its definitely not the technology. And I don’t think it was the talent.

In the coming days, I am pretty sure we will find it was the technique.

It was not getting deep enough data.

It was looking at the data and seeing what you expected to see.

Curiosity was lost.

Finding new perspectives to make sure we have the right data next time.

Hillary Clinton’s campaign will be a case study in where good analytics where not good enough.

Analytics Culture – The key to using analytics in a business is like a secret sauce. It is a unique combination of analytics talent, technology and technique that are brought together to enrich and empower an organization. A successful analytics culture is not easy to create, but DMAIPH can show you how. Contact DMAIPH now at analytics@dmaiph.com or connect with me directly so we can build a strategic plan to turn your company into analytics driven success story.