How to master big data analytics and data management?
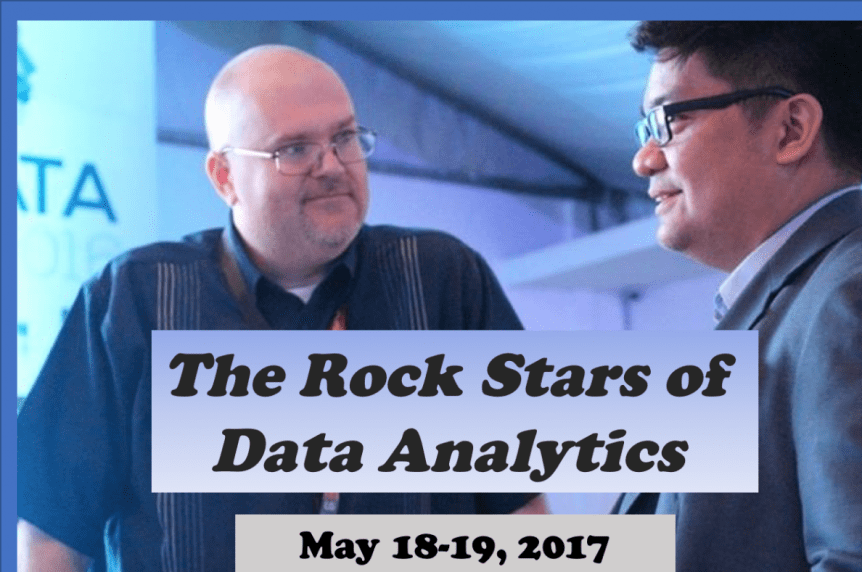
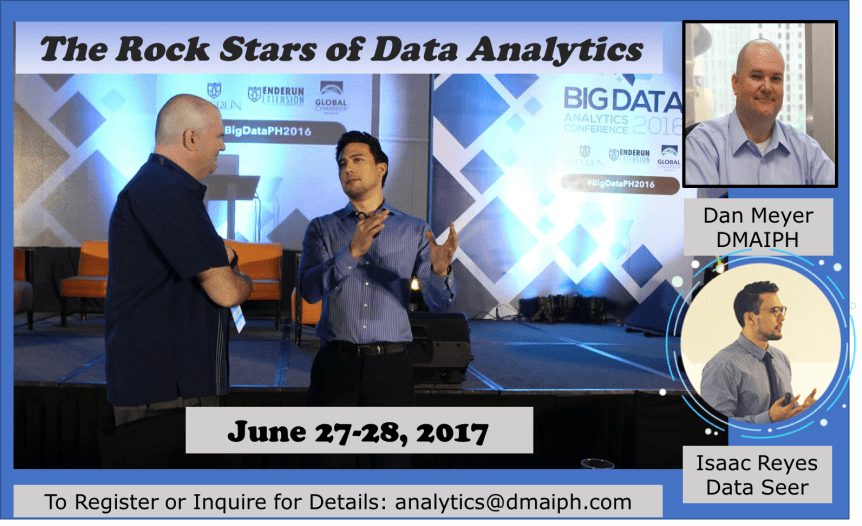
The Rock Stars of Data: Big Data Analytics & Data Management
2-day Class: Big Data Analytics and Data Management
June 27-28, 2017
Discovery Suites, ADB Ave., Ortigas Center, Pasig City
9AM-5PM
Rock Stars of Data Series: Big Data Analytics & Data Management
Data Rock Stars Dan Meyer (DMAIPH) and Dominic Ligot (Cirrolytix) have joined forces to offer a unique training focusing on both the Analysis and the Management of Big Data.
To find out more about our next scheduled public learning session on May 18-19, 2017 in Ortigas or to set-up an in-house training, send an e-mail to analytics@dmaiph.com
Learning Session Description
Building The Data Value Chain. Data is pervasive – everything we do in the modern world uses and generates data in some shape or form: from web sites we surf, the social media we consume, to the mobile devices we use to connect and communicate. Modern businesses also use and generate data, from financial data, to customer data, to transaction data and sensor data.
But data is only a raw material. Regardless of amount, the real importance of data is only determined by the value people and businesses derive from it. Getting data is the first step. Then the challenge becomes transforming the raw material into a processed good: information. Information enables decisions, and decisions create value.
This session is about the basics of transforming data into information: the data value chain. Attendees will learn how to identify the right data, about how data can be efficiently stored, then transformed into a friendly form for analysis, and finally how data analysis can yield insights.

This seminar will lightly touch on each aspect of data identification, collection, storage, transformation, and analysis and involve hands-on use of common data management and analysis tools such as Excel, Tableau and SQL, but is designed for those with little to no prior experience with these tools.
Learning Session Objectives
- Apply cutting edge technologies to organize, interpret, and summarize Big Data in your business.
- Create a process to analyze data and identify patterns not apparent at first glance
- Understand the components of The Data Value Chain: Ingestion, Storage, Transformation, Analysis – and how they are all important to deriving value from data.
- Learn database manipulation and processing basics using the Structured Query Language (SQL)
- Connect a data analysis tool such as MS Excel or Tableau to a database to be able to perform analysis on processed and stored data
In this session, your organization will be able to use:
- Specific skills to effectively frame the problem you’re addressing to uncover key opportunities and drive growth
- Critical marketing steps of orientation necessary before engaging tools and technology
- How to simply and quickly amplify decision making by separating the signal from the noise
- A framework for asking the right questions, allowing the ability to link analytics to business strategy
In this session, your participants will be able to:
- Learn the best practices for organizing, summarizing, and interpreting quantitative data
- Create a repeatable process for analyzing your data
- Shorten the time between analysis and action to avoid “analysis paralysis”
- Know how to get from hard data to well-reasoned conclusions
Who Should Attend
- Business Analysts, Data Analysts and other Analytics Professionals
- Business professionals who are involved in day-to-day analysis of data.
- Data analysts who are already performing analysis using spreadsheets but struggle with manual data processing.
- Managers of analysts or staff who spend a significant amount of their time collecting, analyzing and reporting data.
- IT and Development Staff that work closely with business leaders and decision-makers.
Section One – Big Data—It’s Not Just Size That Matters
- Understand the 3 T’s of Analytics: Talent, Technique and Technology.
- Describe the importance of effectively, analyzing big data in Business today.
- Develop a Data Map to analyze the Big Data in your Business.
- Recognize when to employ Descriptive, Predictive or Prescriptive Analytics.
- Establish clear objectives when analyzing Big Data.
Section Two – Assess Your Current Analytics Culture
- Define What Is an Analytics Centric Culture.
- Describe the issues and trends in today’s analytics field.
- Discover how to find the most important KPIs.
- Learn how to build better management reports.
- Optimize your use of MS Excel for Big Data Analytics
Section Three – Using Business Intelligence Tools
- An overview of BI Tools.
- Tableau Public Demonstration,
- Discuss the Concept of Data Visualization.
- Build A Business Dashboard Prototype.
- Apply a Process to Present Big Data Clearly.
Section Four – Interpreting Your Data and Analysis
- Articulate the importance of accurately interpreting Data.
- Determine how to validate your data analysis.
- Mitigate and analyze Risk, Uncertainty, And Probability.
- Spot patterns and trends through Statistical Analysis.
- Use findings from Big Data to Drive Decisions within your Organization.
Section Five: Presenting the Data Value Chain and Databases
- Discuss the components of The Data Value Chain and the various users and roles involved in transforming data to value: Database and ETL engineers, Data analysts, Business users.
- Learn about basic data architecture and the role of databases in processing data.
- Understand the basics of databases, tables and views.
- Learn about the Structured Query Language (SQL) and SELECT statements.
Section Six: Data Processing with SQL
- Discuss the additional value that can be derived from using SQL for Data Processing.
- Go into detail on various ways of processing and preparing data using SQL.
- Learn about aggregates, conditions, how to join tables, and run queries within queries.
Section Seven: Accessing SQL Tables with Excel
- Learn about Open Database Connectivity (ODBC) and how Excel uses ODBC to connect to external data sources.
- Discover how SQL tables and views can be read by Excel into instant Pivot Tables and Pivot Graphs.
- Understand how changes in database table or view via SQL Inserts, Deletes, and Updates are reflected on Excel.
Section Eight: Performing analysis of SQL-based data using Excel
- Learn about how SQL data can be dissected using the Data Analysis functions in Excel.
- Talk about form tools and macros that can automate manual reporting.
- Discuss tips for reporting and sharing the results of your analysis.
Minimum Hardware and Software Requirements.
- Laptop with Intel Core i3 and 4GB RAM.
- Windows OS with Excel 2007 or greater.
- ODBC and database connections will be provided during class.
Case Studies and Exercises
Dan and Doc will use case studies and group exercises throughout the two-day class. In these activities, the group is divided into teams. Each team will analyze datasets using the principals learned in the various learning sessions. These exercises will also use elements from the case studies as we progress from finding data, to conducting analysis on the data and finally presenting the data.

Learning Investment for 2-day Seminar:
Exclusive Offer!!
Early Bird Rate
P 12,000.00 + VAT
(Pay the full amount on or before April 20, 2017)
Group Rate (Minimum of 5)
P13,000.00 + VAT
Regular Rate:
P 14,600.00 + Vat
(starting April 21, 2017)
All investments includes: 2-day Analytics Seminar with two of the most in-demand Analytics and Data Management Guru in the Philippines, complete with Training Materials, AM/PM Snacks, Lunch and Certificates.
ABOUT THE SPEAKERS
Dominic Ligot, Data Scientist
Doc’s areas of expertise focus on Fintech, Big Data Analytics, and Digital Transformation.
Click here to see Doc’s full speaker/trainer profile >>>
Daniel Meyer, Analytics Champion
Dan specializes in a variety of analytics themed training and speaking option including HR& Recruitment Analytics, Data Analytics, Data-Driven Decision-Making and Analytics for CEO’s.
Click here to see Dan’s full speaker/trainer profile >>>
Reserve your seat here >>>


 Another important tip Just because a market is large doesn’t mean it’s profitable – especially if most of the customers that want a particular product or service already have one and are unlikely to want another. A lot of people get caught up in the width of the market, but forget about the depth. Sales analytics will help you determine opportunity in both dimensions.
 Analytics Culture – The key to using analytics in a business is like a secret sauce that fuels Data-Driven Decison-Making. It is a unique combination of analytics talent, technology and technique that are brought together to enrich and empower an organization. A successful analytics culture is not easy to create, but DMAIPH can show you how. Contact DMAIPH now at analytics@dmaiph.com or connect with me directly so we can build a strategic plan to turn your company into analytics driven success story.


 An American technology and business expert urges Business Process Outsourcing (BPO) companies to prepare for the disruption that will be brought about by artificial intelligence (AI). The Department of Science and Technology (DOST) recently held a talk about how to prepare for the time when intelligent computers take over call center agents’ jobs.