I came across this awesome TED talk about a big data analysis project to determine what country does the most good in the world.
I imagine this is the process that Simon went through to go from a general curiosity to giving an enchanting TED talk.
I have a question. What country does the most good in the world?
I identify the data I need and then I look for that data.
Some of it already is being gathered and is easy to find. Some data I even have to create through surveys and research projects.
I pull together all the data and start to inventory it. To put it into smaller chunk for both analysis and story telling.
As I analyze the data I see many things I expected to see, but I make also lots of discoveries I didn’t expect.
I share the data with other experts to fine tune the story I want the data to tell.
I then am ready to share the data with the intended audience, in this case the world!
Some day soon, that is my dream. To share some amazing data and use it to tell a story worthy of a global audience!
Here are four keys behind my recent run of success:
1. Find Disciples
2. Create Lots and Lots of Content
3. Go Both Horizontal and Vertical
4. Stick with the Plan
One of the greatest pieces of advice I ever got from a mentor was to go out and find three people who could become my disciples. People who understand and believe in the power of using data to driven decision-making.
Throughout the first two-year of my business I was never able to keep more than one at a time on my team as the business evolved rapidly. However, over the past six months I have firmly established two of them in the business as key partners in decision-making. And I still have one of my original influencers close at hand. I know have three disciples who believe in what we do and are able to talk my talk and walk my walk. Mission accomplished.
Another key piece of advice I picked up about a year and a half ago that I have stuck with is create lots of content. I’ve heard this before and see the power of some of my heroes like Guy Kawasaki and Seth Godin when it comes to creating a constant stream of interesting content. However, it took a while for me to find my grove, but since then I have been churning out a fairly steady stream of social media content. I blog, am an active Liker on FB and share a lot via LinkedIn. That’s the second key to my success.
Another part of my success has been adding more and more services to my existing clients. This is a strategy I learned very well with Wells Fargo. Its far more profitable to go vertical with existing clients then try to go horizontal with lots of new clients.
And the final key that has help me rise from the ashes of one failed business to build a successful one if stick to the plan. Yes, its important to adapt and evolve, but those should be in unison with the core reason you went into business in the first place… to empower people to make better decisions. I started with a knowledge process outsourcing business model to being more analytics jobs to the Philippines and have done exactly that.
I saw this article and I think about how good it is to be spot on with something. Having seen this opportunity a few years ago and setting up my business now is starting to seem like an awesome decision! 🙂
When you have an opportunity to get involved with outsourcing, it always sounds like a good way to make some fast money.
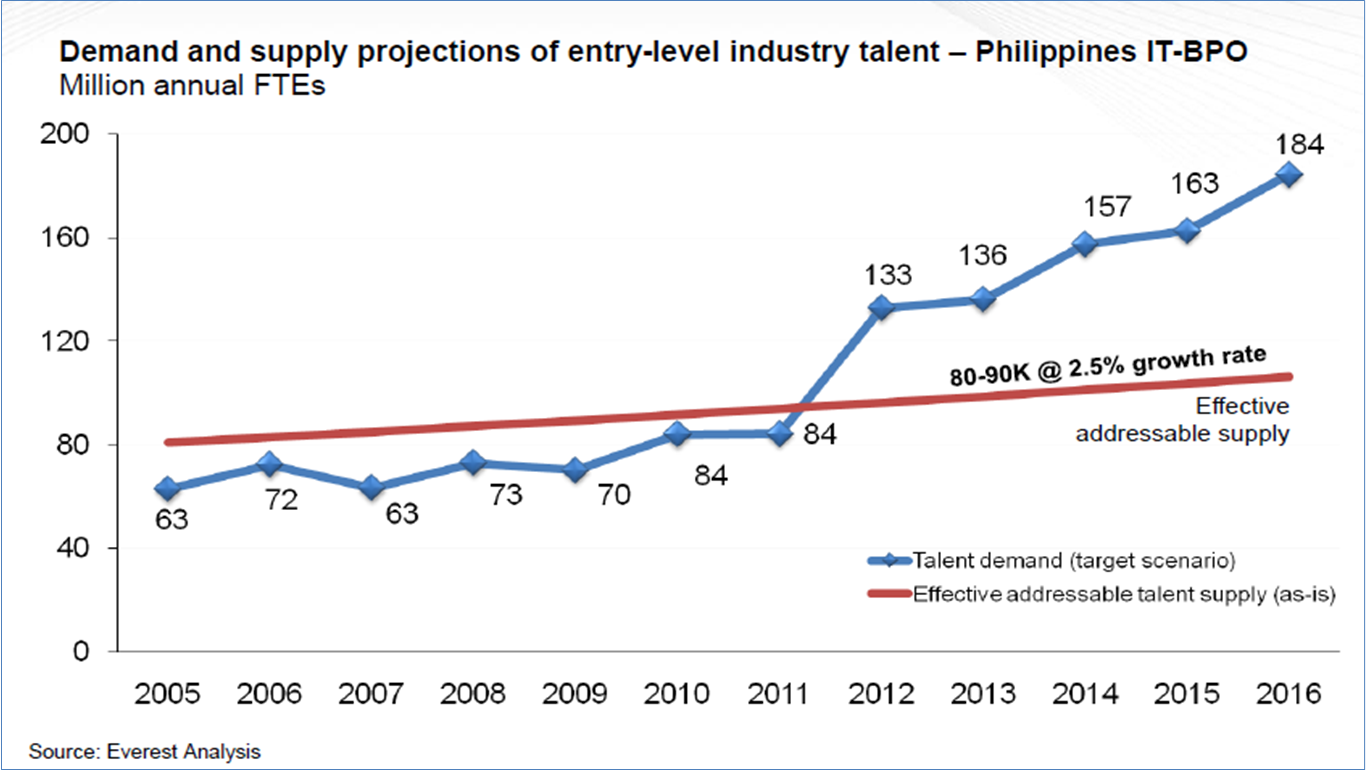
The news has been abuzz for a while now with mounds of data and statistics about the high-speed growth in the outsourcing industry, especially here in the Philippines. Just yesterday I saw a projection that BPOs in the Philippines are expecting to see a 15% growth in revenues in 2014.
You couple that with the fact that everyone here knows someone who is making good money as a call center agent or investing in real estate that will be used by call centers, or have a friend in the US who knows someone who wants to save money by outsourcing. It’s one of those everyone is doing it, so why can’t I kinds of things.
This is all good, but there are just as many failures as there are success stories when it comes to small and medium-sized BPOs. Ones where someone had a client, or a building, or an idea but didn’t size it right and misjudged on cost, or talent or market and had to close their doors and lost money.
So when you have an outsourcing opportunity in front of you, whether it be as provider or a client, make sure you size it right. Here are a few things to think about:
Does the client already have an existing business that they want to outsource? If so, fully understand all the requirements of that job as it is currently performed.
Can you find the talent in the Philippines to provide just as good if not a little better service as currently is being provided? A common mistake is thinking that cutting both cost and the level of service will be a win-win.
How scalable is this project? How can both ends be managed in a way that allows for uninterrupted growth? Often things start easy when it’s a pilot, but once you get into production a host of issues can pop up to derail growth and ultimately the partnership.
How stable is the client? Are they a startup that has a great idea and is underfunded? Those are plentiful. Or are they an established business with a strategic plan that includes the fortitude to successfully outsource a key piece of its business? These are hard to find.
That is just a few things that come to mind when I think about sizing the opportunity. Having set up 5 teams in the past year to provide outsourcing services, I have learned a lot about making sure I get the sizing done right. Keeping a client happy is all about under promising and then over delivering when it comes to time, talent and cost.
Analytics Outsourcing – DMAIPH has successful set up Filipino analytics teams for over a dozen U.S. based businesses. Offering both virtual and office based teams that specialize in problem solving using data, new technology and analytics techniques is our strength. Finding and empowering analytics talent is increasingly challenging, but we have it down to a science. Contact DMAIPH now at analytics@dmaiph.com or connect with me directly to learn more about how to set up an analytics-centric team in the Philippines.
Often you here people in business talk about how it’s more important to be either a master at one thing or a jack of all trades. When it comes to being a great analyst, you see many who are great because they have mastered their subject or a certain analytics tool. On the flip side you see many great analysts who seem to know a lot about a lot and are proficient across multiple subjects and/or can use many analytics tools. So which is better?
From both my experience and my personal perspective, analysts who know a lot about a lot are rarer and more valuable to a business. Based on both an accumulation of knowledge and the ability to work in various environments, analysts who are considered to jack of all trades kinds are in general great analysts.
However, I have also found that most business actually find more value in master of certain type of analysis work or someone who is great at using a certain tool. Specialization is something that is on the surface very impressive as it shows discipline and competency in a certain subject. They know a lot about their area of expertise and are recognized as such.
Occasionally you can even come across analyst who are both knowledgeable about a lot and even more knowledgeable about a specific subject matter. Now that is a rare breed.
So, no matter what type of analyst you are or want to be, the bottom line is you need to constantly read and connect and expand your knowledge… you need to know a lot if you want to be great!
Analytics Culture – The key to using analytics in a business is like a secret sauce. It is a unique combination of analytics talent, technology and technique that are brought together to enrich and empower an organization. A successful analytics culture is not easy to create, but DMAIPH can show you how. Contact DMAIPH now at analytics@dmaiph.com or connect with me directly so we can build a strategic plan to turn your company into analytics driven success story.
About a week ago I got a random e-mail from a strategic research company based in India asking me if I could help them find some information on the domestic remittance market in the Philippines. They specialize ins preparing research for various financial and banking segments and are looking to put together a paper on this topic. From my experience with Wells Fargo and having set up a business in the Philippines, I’ve managed to make a lot of connections that would undoubtedly help find them some of the data they need.
First off though, I told them up front… there is no where you are just going to find the data they are looking for in one or two places. Most of the data on this topics is going to be unstructured… and what is available is going to be with a narrow focus and incomplete.
And this is something I am very good at… creating data. Taking a diverse collection of sources and using them to create a landscape of information. Data creation definitely falls more into the art side of analytics, because it’s all about networking and connecting the dots and taking educated guesses… not a lot of hard science!
This kind of analytics is very hard because most analysts are only comfortable working with data that’s been validated, is housed with a structured architecture and can be easily queried. They like playing with big data when it’s in a defined sandbox. The data needed for this project is scattered all over the place and in many cases hasn’t even been sourced yet.
So looking at some of the requirements; (1) domestic remittance transaction counts and peso volumes, (2) top remittance corridors, (3) major players in the market, and (4) channel used for transfers… its pretty clear we’ll need to lean on the Central Bank, and several other financial services providers to get data. We also need some demographics on the people doing the transfers and look at recent trends… and in addition, the client wants to include bill payments. It’s an extremely ambitious project.
Pretty much every time I do an analytics training I talk about the most ambitious analytics project I have ever taken on.
One day back when I was still with Wells Fargo (circa mid 2008), my boss came into my cube and tossed a book on my desk. “Daniel, take a look at this. I when I come back I want to share with you a project I have in mind.” I knew he was going on a business trip that day and would be back in two days so I had that time to read the book and figure out what he wanted me to do before he got back.
The book was Stephen Few’s Information Dashboard Design and it forever changed my life.
When I saw the book I was immediately enthralled by the charts and graphs, at this point in my career I had built thousands of charts and graphs and data visualizations in excel and was generally considered a master at it. But up until that point I had never heard of the term business dashboard. It was obvious to me that the idea was a user interface to access business data in one view, but I likening it to a car’s dashboard was a brilliant way to make the concept easy to digest.
I spent most of the next two days devouring the book. And I knew what he wanted, some kind of intranet site to display all the different reporting metrics I was generating for the group and mainly diffusing via email.
When my boss got back from his trip, I eagerly anticipated his eventual reappearance in my cube.
Finally after lunch, his admin called me and asked me to meet him in the conference room. On the dry erase board he had sketched out the most ambitious analytics project I had ever dreamed of taken. He didn’t just want a place to post information and reports, he wanted something far cooler.
His requirements included real-time sales data, real-time scrolling exchange rate data, headline news data from various sources and he wanted it to be available on both desktops and on TV screen positioned throughout the floor so everyone can get a pulse of the business at a glance. It was brilliant, but it was also going to be ridiculously hard to do. I mean, he wanted a life feed from CNN. How was I going to get that?
But being the dedicated analyst, the next day I took his vision and created a one page power point mock-up. Once he felt I had the design the way he wanted I started checking around with different resources to see what it would take to pull this off. After several conversations with our project management team.. in-house developers and database owners, I came up with a figure of over $1,000,000. It was going to be a huge six month project to get everything in.
I kicked off the project and started putting together the project team…. and then we had an all team budget meeting. We need to cut some things out of the budget do and when the boss started going around the room and looking at each person , I already knew it… “Daniel, we are going to have to cut your data project”. Inside I cried, but I had been around long enough to know this idea wasn’t dead, it was just going to take a different form.
Two years later, we basically had built the dashboard but it took a lot different form then I had originally put together. We had the reporting metrics on an intranet site, we had an automatic system to feed us real-time FX rates, we were using the Tableau BI tool to develop some awesome data visualizations… about the only thing missing was the live CNN feed.
But boy wouldn’t it have been cool to build that dashboard the way we originally had dreamed it up!
Had an interesting text conversation yesterday that I thought worth sharing as it brings up a good question… can you have process improvement without analytics?
I got a text randomly yesterday from a friend who is considering a new job as an analyst for a hospital.
Friend: Hi Dan, I got a question on analytics. If I wanted to increase the utilization of rooms in a hospital, what kind of data should I be looking at?
Me: Do you want a well thought out plan or a quick and dirty answer?
Friend: I suppose quick and dirty.
Me: Length of patient stay. % of special needs patients. Physical dimensions of space to see if space is optimized. Understanding of patient process flow to see where wasted time is. Then put it all together to come up with some current metrics and then track against optimal case metrics.
Friend: What exactly do I need to be looking for if I go look at length of stay? What are optimal case metrics?
Me: To optimize usage, you need to gather data for key metrics as they currently are. And then project the same metrics is everything was working at its most efficient state. Length of stay is a key metric as you need to determine what is causing longer than expected patient stays. This will help you minimalism things causing wasted time. Analytics will identify waste and then you use metrics reporting to manage the waste. Make sense? This sounds like as much a process improvement project as it does analyst work doing some new metrics reporting. It could be a very interesting project with both short-term consulting on the process improvement and long-term need for an analyst to monitor the data via metrics reporting.
Friend: Yeah, you are making lots of sense. So, if I were trying to shorten length of stay, I would look at current length of stay per case. Then look for all the factors impacting length of stay, and then improve the process flow for the ones where its taking too long.
Dan: Something like this is how I would start.
Based on my experience, when you are presented with a business problem and asked to help solve it. It’s almost always an issue of a process that is inefficient or wasteful that is the root cause, but you need plenty of data to identify that. A good analyst is just as much a process improvement guru as they are a reporting expert.
Analytics Consulting – As a founding member of Gloabl Chamber Manila, DMAIPH specializes in a variety of analytics consulting solutions designed to empower analysts, managers and leaders with the tools needed for more data-driven decision-making.
We have helped dozens of companies in both the U.S. and the Philippines, get more analytics in their business.
Contact DMAIPH now at analytics@dmaiph.com or connect with me directly so we can tailor an analytics solution made just for your unique requirements.
Here is a follow up to the student I am helping with her class assignment on Logic… She asked me how I apply logic as an analyst with an example and here is what I came up with.
How I Use Logic As An Analyst
According to Webster’s Dictionary, logic is “the science or art of exact reasoning” and analyst is “someone who is skilled at analyzing data”. The two definitions are where I start when how I think back to the application of logic during my career as an analyst.
To solve business problems you need data. You need to identify the right data, analyze it and communicate your results. In all three aspects of analysis work you need to employ logic.
Basil Rathbone as Sherlock Holmes
When you are given a business problem to solve, say how to determine a market for a new project or trying to figure the cause behind a slowdown in production, you need to start with data. What data you get, how you get it and where you get it from is all driven by a combination of your business experience and logic.
Logic helps you eliminate data that useful to the problem at hand. One time when I was looking for data on current remittance flows to China, a logic driven approach would be to start looking at Chinese economic websites. Which I did using the science of logic.
Once I got some data sources on remittances from the US to China, I then used logic in my analysis. Is the data current? Is the source reliable? Is it relevant? Logic dictated that I not use sources that were more than a year old, where not from government sources and where directly providing data on remittances to China.
In my analysis I saw several patterns, most remittances where going to only two provinces. That is logical when you research to see that most immigrants to the US come from these two provinces.
And when I was ready to communicate my results, my choice on which application to use, what tone to use in my language and what visuals to use were all driven by my knowledge of the audience.
Since this was for a senior manager, well-versed in remittance patterns and very comfortable with big data speak, I just cut and past some charts from Excel into an e-mail and gave him 2-3 bullet points about the patterns I saw and noted my source. It was logical that he didn’t need a lot of explanation or easy to see analysis given his pedigree.
If this had been for a more general audience of say fresh grads who have never looked at this kind of data before, it would be logical to use PowerPoint, supply several descriptive notations and some easy to digest visuals that show remittance trends.
Trying to provide students with a report designed for senior managers is illogical for someone like myself with a lot of business analysis experience.
In the end, it is my opinion that few career paths call for a more consistent application of logic then does that of an analyst.
Analytics Leadership – DMAIPH specializes in arming the Data-Driven Leader with the tools and techniques they need to build and empower an analytics centric organization. Analytics leadership requires a mastery of not just analytics skill, but also of nurturing an analytics culture. We have guided thousands of Filipino professionals to become better analytics leaders. Contact DMAIPH now at analytics@dmaiph.com or connect with me directly to discuss a uniquely tailored strategy to ensure you are the top of your game when it comes to Analytics Leadership.
One of my trainees recently asked me for some help with an assignment she had in her philosophy class. Now I am such a Star Trek fan aka Trekie, that of course the first thing that comes to mind in the character Spock.
I imagine that is anyone ever took a formal survey of analysts and analytics professionals, most would list Spock high on their list of “cool characters.” The use of logic to solve problems is a key plot point in several episodes and movies. Anyway, I digress…
The assignment is to look at the paperwork in a business and determine how logic and logical principles are applied. I look at logic as being used primarily in two different facets of paperwork.
1. to set priorities… using deductive reasoning to decide what priority is more important and which one to work on first. This is something that is hard to teach and a common interview question. Trying to determine if a person knows how to establish priorities tells you a lot about how logical they think.
2. to establish procedures… logic is used to set up a process like an assembly line or a pipeline where things are done in a routine that is most logical. Being efficient and optimizing a process require a lot of logic in the design and implantation of the process.
So for paperwork… the paperwork that gets done first is the highest priority like payroll… logic dictates that paying employees is the most important and logic helps you set up a process for paperwork… like if a form needs three signatures, you would use logic to set the order of whose signature you get first, second and third
When you have a problem with a process or too many priorities to accomplish all, you use logic to help you solve the problem.
Analytics, or the discipline of using data to drive decision-making in a business, is closely related. Logic is used to identify the data you need, logic is required to interpret the analysis and logic is needed to determine how bet to communicate your findings.
When you look at any business (or government, organization, structure, etc.), you need to employ logic to make that business run and paperwork is a big, big part of the resulting of using logic. Forms, reports, summaries, etc… they are all receptacles of logic that are used to keep things moving.
So when asked why I do what I do when it comes to the paperwork in my business, I am going to tell you because its logical to do it that way. Or as Spock might say, “Logic dictates how and why we use paperwork.”
General Analytics – Analytics is the application of using data and analysis to discover patterns in data. DMAIPH specializes in empowering and enabling leaders, managers, professionals and students with a mastery of analytics fundamentals. Contact DMAIPH now at analytics@dmaiph.com or connect with me directly to find out what we can do to help you acquire the analytics mastery you and your organization need to be successful in today’s data-driven global marketplace.


 However, I have also found that most business actually find more value in master of certain type of analysis work or someone who is great at using a certain tool. Specialization is something that is on the surface very impressive as it shows discipline and competency in a certain subject. They know a lot about their area of expertise and are recognized as such.