Social Media Analytics… It’s not just a marketing tool

Most people I talk too think of Social Media Analytics in terms of a marketing tool. How many Likes, Shares, Follows, etc are my posts getting. Some take it a bit further to look at engagement factors as well. And a very few use it to measure the Return On Investment when it comes to the cost benefits of doing social media marketing.

All of the big social media sites like Facebook, LinkedIn, Twitter, etc. have built in Analytics tools to help businesses see the impact of their social media efforts in theses terms.

But who is using social media to listen to their customers? Again many have someone responsible for monitoring sites to address customer complaints. Some have teams that do this 24/7 and try to spin every negative post into a positive. And a few actually are proactive in engaging customers via social media by anticipating needs.

And who is using social media to keep track of their competitors? Again some do follow them. And a few actually track competitor behavior and use their findings in setting strategy.

And only a few layer their social media Analytics on top of demographics. LinkedIn and Facebook have built in demographics right there with their Analytics available to users.

So I guess the question is are you getting the most out of social media?

Is Analytics more an art or is it more a science? 2 of 3

gapminder-data-visualization-psfk1 - CopyRecently, a friend of mine replied to a post asking me for more details about how I would analyze and mitigate risk in a business…. “the details are a little thin. As a former professor of business decision science, I would like to read more about the model building tools and techniques of how you do it.”

My reply was “That’s a great question Chris. As a blogger I try to not go into too much detail in these posts as most of my audience is relatively unfamiliar with concepts like Big Data, Business Intelligence Applications and Predictive Analytics. That said, I can think of a couple of ways to reply to your comment. I often say that Analytics is as much an art as it is a science. So, I will craft two blog response one for the artists and one for the scientists.” And then I will conclude with my own unique approach to analytics.

So yesterday we covered the science side, today lets look at the art side. They say a picture is worth 1000 words, well I agree and would take things further and say a good pie chart is worth 10000 rows of data. 🙂

Analytics as an art form is a more appealing to the average person, because most people don’t like math. They are afraid of having to use excel and rows and rows of data confuses them. This is why we have analytics, so people who do like math, numbers and excel can figure things out for the majority who don’t.

One of the big buzzwords going around right now is storytelling. Businesses need to engage customers in the way people are engaged by a good story. Marketing team are charged with connecting with an audience in the same way a great film maker or author does. And to do this, marketers have to be very good at getting their data and analytics to a point where it can tell that story.

Data visualization is one of the most powerful skills an analyst can use. Whether it be by using charts and graphs in excel, an info graphic or a business intelligence tool like Tableau that creates data visualizations; analysts can now be artists as much as scientists.

So what does this have to do with my friend Chris’s question about business decision science. It used to be that most decision were made after a long process of drafting requirements for the IT team, a long development cycle and static reporting put into place. However, that’s old school. Now good leaders and decision-makers access data themselves and do a lot of their analysis by playing around with the data.

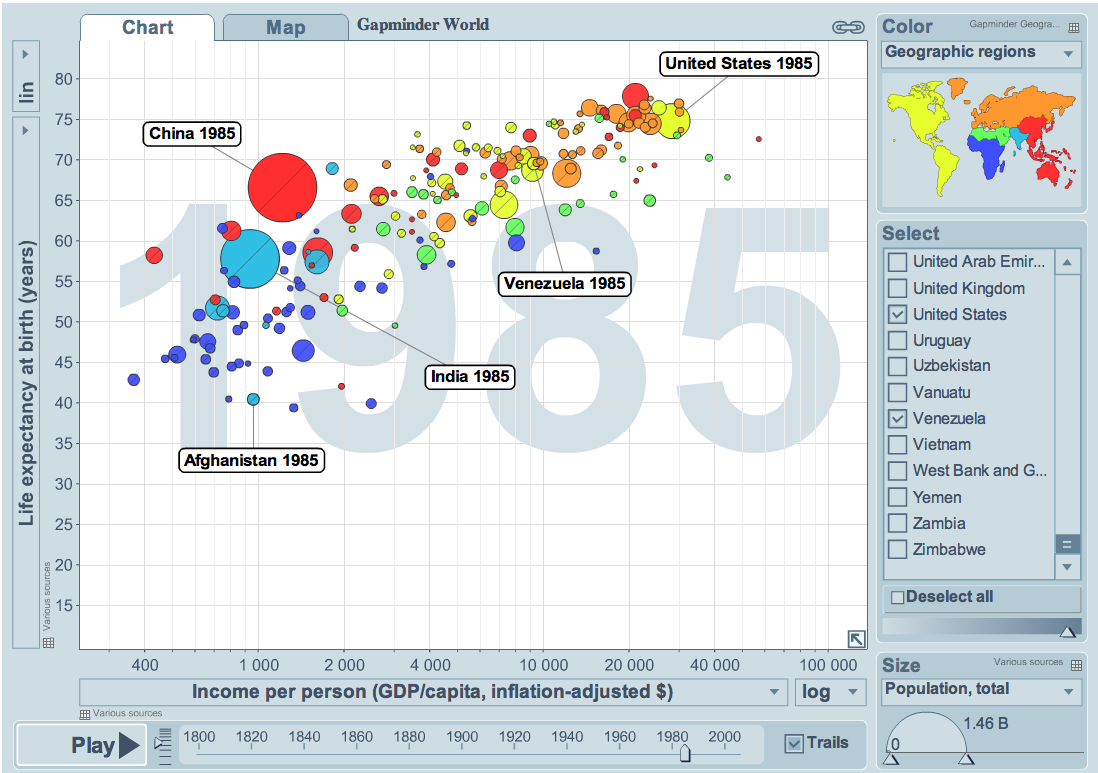
Knowing what data to pull, how to analyze it for patterns and trends and putting into a format where it can be used by decision makers is still the same, what’s different if the ability to get it to tell a story to the audience. My all time favorite master of data visualization is Dr. Hans Rosling, If you don’t know who he is, check out his site http://www.gapminder.org

Watching him in action is the best way to see why I think that analytics is more of an art then a science. You can have all the data in the world, and you can have great analytics talent working with it using cutting edge technology. But if you can’t use that data to influence your audience in powerful ways, then you are missing the boat.

Is Analytics more an art or is it more a science? 1 of 3

PrintRecently, a friend of mine replied to a post asking me for more details about how I would analyze and mitigate risk in a business…. “the details are a little thin. As a former professor of business decision science, I would like to read more about the model building tools and techniques of how you do it.”

My reply was “That’s a great question Chris. As a blogger I try to not go into too much detail in these posts as most of my audience is relatively unfamiliar with concepts like Big Data, Business Intelligence Applications and Predictive Analytics. That said, I can think of a couple of ways to reply to your comment. I often say that Analytics is as much an art as it is a science. So, I will craft two blog response one for the artists and one for the scientists.” And then I will conclude with my own unique approach to analytics.

So let’s tackle the science angle first. In corporate and academic circles, analytics is looked at primarily as a science. You have millions of pieces of data, you take that data and you analyze it and then you use the analysis in your decision-making. There is a lot of science in this approach.

I often say that in the past two days we have created more data than we created in the entire history of human existence up to the past few years. This is big data… it’s mostly unstructured and its challenging to manage. It takes an understanding of how data is collected, stored, accessed and disseminated. This is why analytics usually starts with the IT team. They manage the databases that do all these things. SO as a scientist, you need to have a lab… in most cases this is a database or data warehouse. How easy is it to identify, inventory and integrate data in your business? Does you lab contain all the raw materials you need for your experiments?

Once you have your data, you need tools to analyze it, to look for patterns and discover new opportunities or to identify risks. There are many instruments you can use like a scientist uses a microscope. Excel is the most common, but there is an ever-growing number of analytics tools that you can use to glean more intelligence from your business. Some of the tools are very complicated and require a lot of training, other are free and can be learned in a matter of hours. SO as a scientist, you need to use the right tool at the right time to get just the analysis you need. What kind of tools are you using for analysis? What kind of tools are you using for reporting and sharing information? If you are using excel to design Powerpoint Decks to share via email, then I have news for you…. you are headed towards joining the dinosaurs. 🙂

And the final part that to me is the most scientific… applying the tools. There many methodologies out there about decision-making. You are starting to see a lot more college and post-graduate course work in decision-making… this is what my friend Chris is talking about in his comment. Having the materials and the tools are no good if you don’t have tried and tested ways of using them so you can trust the results of your analysis. If you want to get into predictive analytics to try to guess right about sales trends or market direction, you need to have a lot of science on your side.

Most businesses struggle having the analytics in place to fully understand where they have been and where they are now. Getting into a science driven way to predict the future requires data, tools and methodologies that you traditionally only find in big companies that invest in well-trained and/or educated professionals. When you have that then you can really benefit from the science side of analytics.

However, are you just as well versed on the art side of the equation? And what if your business doesn’t have the capability of investing in the same things the big boys use? How can you maximize the art side of things? Let’s talk about that in our next blog!

Learnings from a friend’s “Elements of a Losing Culture”

http://fortune100coach.wordpress.com/2013/08/26/elements-of-a-losing-culture/#comment-202

I just read my good friend and mentor Bjorn’s blog post and it made me think about how closely tied a business culture is to the analytics used in that business. Bjorn posted, “Success leaves clues and so does its opposite. Reality checks are important so we can tell where we are and properly assess what needs to be done. When we can’t seem to find the clues indicating a successful culture it’s time to look for its opposite.”

Let’s look at that comment from an analyst’s prospective. One of the clues I look for in a successful organization is an understanding of how decisions are made. Are they top down? Are the inclusive? And most importantly to me, how much data is analyzed prior to making decisions. For the most part great companies make great decisions and this feeds a successful and healthy culture. When decisions are made off the cuff, with little input from the ranks and without the benefit of good data… you get a recipe for a losing culture.

Bjorn mentions several other indicators of a Losing Culture. I want to add some data driven perspectives to them as well.

1. Lack of clear target, vision, etc. Having good metrics to monitor progress. Setting goals and then reporting and communicating them. There are key ways you can measure if a business has a healthy focus.

2. Lack of alignment. People don’t know how to compare themselves or even worse improve themselves. There is no sense of the big picture and little effort to work across business lines or help other teams. You need a lot of visualization of data and analysis to show how it all fits together. Dashboards and internal web sites, using visualizations like info graphics and data visuals can help people feel aligned and give them a sense of where they fit in.

3. Lack of authenticity. Know if your customers care. Knowing if your employees care about your customers and each other. Knowing if you stack up well with the competition. Knowing what about your business causes others pain and what causes satisfaction. Using surveys, focus groups and other tools to gather feedback will help your business be authentic to your customers and your employees. You cant really have loyal and engaged customers if you don’t come across to them as authentic.

To learn more about Bjorn and his consulting business, you can follow him here: http://fortune100coach.wordpress.com/

Analytics Tool for Sales #2 – Competitor Landscape

IMG_1833Another blind spot for a lot of business leaders is knowing their competition. Most have some sense of where they stack up on price and know what the competition offers, but few put any real data and analysis behind it. They make a lot of business decisions based on personal observations and historical knowledge. Very few mystery shop or put together a competitor landscape.

Per Wikipedia, competitiveness pertains to the ability and performance of a firm, sub-sector or country to sell and supply goods and services in a given market, in relation to the ability and performance of other firms, sub-sectors or countries in the same market. You take data points on the various aspects of products and services and you visualize them to see where you rank. Based on your ranking and the variances between competitors you can have a more focused business strategy and make more data-driven decisions.

Competitive data can be gathered off the internet, by phone and in person mystery shopping and surveying your own customers. Its a very powerful piece of information to know what your own customers are buying from your competition and why. When I was at Wells Fargo, I build a competitive landscape of all the primary money transfers business and monthly updated the management team with our rankings and trends. We would often use this information to adjust pricing and launch new marketing initiatives.

Do you know who your competitors are, where they are better than you and how you stack up in your own customers minds? DMAI offers a suite of business intelligence solutions to small and medium sized business including building and maintaining a competitor landscape for your business.

Analytics Tool for Sales #1 – Demographic Profiles

philippines-outsourcing-teamOne thing that amazes me is the lack of knowledge most sales people have about their current, former and potential customers. Who are they? Where do they come from? What do they look like? What are there habits? What appeals to them? These kinds of questions are often answered by personal observation. Most business owners and leaders don’t take the time to understand the demographic data of their market and miss key opportunities all the time.

According to Wikipedia, A demographic or demographic profile is a term used in marketing and broadcasting, to describe a demographic grouping or a market segment. This typically involves age bands (as teenagers do not wish to purchase denture fixant), social class bands (as the rich may want different products than middle and lower classes and may be willing to pay more) and gender (partially because different physical attributes require different hygiene and clothing products, and partially because of the male/female mindsets).

In short, every business owner and leader should have demographic data at their fingertips so they can analyze which customers are the most profitable and what they look like. Then its a matter of developing marketing schemes to attract more of them using the underlying data. Know your market and the markets around you.

There are numerous sources of free, publically available data available online. The US Census Bureau has one of the most detail collections of demographic data ever collected. As do other US Government Entities like the Bureau of Labor Statistics and the Central Intelligence Agency. There are also numerous organizations that supply global data like the United Nations, the World Bank and the International Monetary Fund. Many countries also publish valuable data on their websites like Central Banks and Government Statistics Offices. The Philippines in particular has some pretty solid data available to use for demographic profiling.

DMAI specializes is building demographics profiles based on your customer data and the public data about the markets your operate in. Stop guessing and minimize lost opportunities by working with DMAI to get your the demographic data you need to make more data-driven decisions.

13 Months in the Philippines – Lesson 8 – December 2012 – Holidays in the Philippines

IMG_1114 Kalookan, Metro Manila, Philippines

As 2012 came to a close, things really started to slow down. I took full advantage of this to prepare of a big launch of DMAI in January. We didn’t go home for the holidays, and ended up just staying in Makati to enjoy Christmas and New Years. And boy was it memorable.

The Winter Holidays in the US start with Thanksgiving. That’s when the malls have huge sales and you start seeing Christmas lights and hearing Christmas music in the malls. However in the Philippines that starts in September. So, but December I was pretty fatigued from hearing and seeing the Christmas cheer and looking forward to finally seeing the day come and pass.

There were a couple of additional interesting lessons I learned. From the period between Christmas and just after New Years, all movies show in Manila are Filipino made films. No Hollywood blockbusters or international films. It’s both good and bad, it allows Filipinos to relish in their own productions and guarantees viewing for films that might otherwise be missed. However, they are of course all in Tagalog. I went to one and got some of it, its was a romantic comedy so most of the jokes don’t need translation, but boy wouldn’t it be nice if they had subtitles.

The other one that really stands out is the fireworks. In the US we do fireworks in a big way on July 4th. There are also some on New Years or Veterans Day or Memorial in places, but fireworks really cant be enjoyed when its cold so for the most is just Independence Day. In the Philippines in Christmas Eve, Christmas, New Year’s Eve and New Years Day. Staying on the 10th floor of a corner condo in Makati I could see fireworks all around from Pasay to Manila to Makati. Big and Small. It was amazing. And after the smoke was so thick it was like fog. It was truly amazing.

From an analytics standpoint I took away a couple of things. Know your holidays. For example, if you are an American company doing business in the Philippines know the holidays so you can keep your people happy. The second is that someone needs to do some analysis on the lost revenue of just showing Filipino films. They still make good money, but it has to be tough on the cinemas to sacrifice profit for art over a two-week period where everyone is at the malls.

Analytics Tool > Enchantment > http://www.guykawasaki.com/enchantment/

Analytics Concept > Business Partnership > http://en.wikipedia.org/wiki/Business_partnership

YouTube Resource > http://youtu.be/f66naHGTsFU

My Analytics Story – My passion is solving problems by bringing together the best talent, cutting edge technology and tried and true methodologies. DMAIPH is all about empowering people towards better Decision-Making through the use Analytics and business Intelligence. This is what I do best. Contact DMAIPH now at analytics@dmaiph.com or connect with me directly for a free consultation about getting more analytics into your career and your business. 

13 Months in the Philippines – Lesson 6 – October 2012 – You Can’t Go Home Again

004Alabang, Metro Manila, Philippines

October was a crazy month. Started out with an office in Taugig. Then spent most of the month in Clark. End the month back in California for vacation. Each story could be its own blog post, but for the sake of moving the narrative along, I’ll just briefly touch on each.

We found this great office space in Taugig. It wasn’t the best location, but good enough. It wasn’t the perfect size, but more than enough for our first year or so. And it was very reasonable as far as price and lease terms. The problem was we weren’t making enough money to cover the cost and my partners felt it to risky to keep the office with the hope that we eventually start making positive revenue. It would have made a great home. I’m still convinced that was a huge mistake because with a dedicated space I could have been running all kinds of trainings and seminars there. Anyway, it’s another simple analytics exercise. Basic accounting is always a foundation of any analytics exercise. Are you brining in enough money to pay the bills?

Going to Clark was a pretty cool experience. I got used to taking the MRT from Makati to QC everyday, I like the drive on the NLEX, and I felt at home in Clark. Being an old American Air Force base in the middle of one of the most beautiful parts of the Philippines, it felt like I was in Florida. Having grown up in a military family and spending most of my childhood summers in Florida… its was like being home again. Getting out into the provinces on a regular basis reaffirmed my belief that the future of the BPO industry is not in Manila. Things didn’t work our with your client, but I made a lot of connections in Clark that will always be worth the lost time on the failed project. One of the key lessons here, understand the amount of effort it takes your workforce, clients and/or customers to travel to get to you. A lot of companies don’t really analyze the market they are set up in, especially when it comes to recruiting talent.

At the end of October we came back to the US for a mini vacation and it was well-timed. BPO Elite was dying, the family needed some comfort time back home and it was just in time to catch the Giants winning the World Series. However, after spending six of the most amazing months of my life in the Philippines, it really didn’t feel like home. Its a lesson I’ve known since I spent a semester of high school in Japan, but home really is where the heart is. And for so many reasons for me that’s no longer the US. It’s the Philippines. You cant go home again, because where ever you are passionate and feeling alive… that’s where home is. And its the hardest part of analytics to understand… because there are no number or datapoints involved.

Analytics Tool > Microsoft Power Point > http://office.microsoft.com/en-us/powerpoint/

Analytics Concept > Process Improvement > http://en.wikipedia.org/wiki/Process_improvement

YouTube Resource > http://youtu.be/Q89qAbAAR3Q

My Analytics Story – My passion is solving problems by bringing together the best talent, cutting edge technology and tried and true methodologies. DMAIPH is all about empowering people towards better Decision-Making through the use Analytics and business Intelligence. This is what I do best. Contact DMAIPH now at analytics@dmaiph.com or connect with me directly for a free consultation about getting more analytics into your career and your business. 

13 Month in the Philippines – Lesson 5 – September 2012 – Cracks in the Pavement

IMG_0994 Clark, Pampanga, Philippines

In September we stated working for a client that at first seemed to be a wonderful opportunity. They asked us to help them set up a manpower staffing business in Clark, Pampanga. It was a very interesting proposition. We would go out and sell the business and get a 50% commission on any business we brought in the door. We were given an office space, internet access, business cards, a business proposal and we found a list of potential clients to market too. We started doing a multi channel sales campaign with an e-mail blitz, phone call and in-person meetings. We also did some deep dive competitor research including mystery shopping. And we networked with the government agency in charge of the Clark Freeport Trade Zone. But we made a lot of assumptions and mistakes and after about three weeks of travelling from Makati to Clark (about 2 hours each way), things hadn’t worked out the way we had hoped for. Let’s look at a couple of the issues and analyze them.

1. We decided to set up shop in an area we were not at all familiar with. To mitigate this we hired a local with manpower experience.
2. We had to spend a lot of time travelling, so we had a small window for meetings. So we made sure all appointments where confirmed the day before.
3. We wanted to get to know the way things worked. So I networked with several key people via LinkedIn and in person appointments.
4. We didn’t have any upfront revenue. We got our client to pay most of the upfront costs for marketing and promotions.
5. We need to get our name out there. We sponsored a job fair and I got a speaking engagement at the event.
6. We had to assess the market opportunity. I had a couple of trainees build a prospective client database and map out locations.

So all things looked good. We had a great opportunity, I had applied a lot of analysis and we were ready to go.

But there were crack in the foundation and they had nothing to do with my analysis or our strategy. They had to do with people.

Even the best laid plans don’t work our if you cant count on the people to execute the plans. Partners got distracted, staff had to deal with personal challenges and personal life started to suffer from professional stresses. By the end of September there were more cracks in the pavement then I had cement to fill them with.

But it was still so much fun, so much adventure, so much excitement I just rolled with the blows and kept pushing forward!

Analytics Tool > Tableau Public > http://www.tableausoftware.com/public/

Analytics Concept > Competitor Landscape > http://en.wikipedia.org/wiki/Competitive_intelligence

YouTube Resource > http://www.youtube.com/watch?v=bj1q4zunuN0&feature=share&list=PL8D46F50D27222FD4

My Analytics Story – My passion is solving problems by bringing together the best talent, cutting edge technology and tried and true methodologies. DMAIPH is all about empowering people towards better Decision-Making through the use Analytics and business Intelligence. This is what I do best. Contact DMAIPH now at analytics@dmaiph.com or connect with me directly for a free consultation about getting more analytics into your career and your business. 

13 Months in the Philippines – Lesson 2 – June 2012 – Training is My Passion

522Pasay City, Metro Manila, Philippines

I did a trial run of the Introduction to Analytics training back in December 2011 with some interns and business partners, which helped me prepare a two-day training class. I launched the two-day class with the target of fresh grads in late May 2012, and I conducted several of the classes over the course of the next six months. It was in June however that I really figured out that I was an amazing trainer and that I could enchant an audience by talking about analytics.

I have always liked being in front of an audience and being empowered to talk about things I am passionate about it. I get a huge rush of adrenaline that can last for several hours. This calling originally led me to traditional classroom teaching but after several misadventures post graduate school, I took the job with Wells Fargo to pay the bills. Fifteen years later I left Wells to do training full time. In the interim I did a lot of ad-hoc and informal training in various way at Wells although I never had trainer in the title.

Per Wikipedia, a Trainer is a person who educates employees of companies on specific topics of workplace importance. While a teacher is simply who provide schooling for pupils and students. I have found that I am exactly in the middle. And there are very, very few people who can train like a teacher. People who can provide hands on, useful content in a short time frame, but deliver it in way that has the empowering effect of taking an actual academic style class are worth their weight in gold. These are the great trainers or favorite instructors who end up becoming speaker and lectures. They have both the ability to train on skill and teach on knowledge. This is what I learned about myself last June.

From an analytics standpoint, I learned a lot about how to construct a training program. Budget, Recruitment, Venue Management, Staffing, Marketing, etc. I learned a lifetime worth of lessons in a few months. I was able to look at each of these topics and find data to compare what I was doing to other benchmarks. Am I efficient, am I cost-effective, am I marketable. Lots and lots of data to bring into my analysis of how to grow my business.

Analytics Tool > Microsoft Excel > http://office.microsoft.com/en-us/excel/

Analytics Concept > Big Data > http://en.wikipedia.org/wiki/Big_data

YouTube Resource > http://www.youtube.com/watch?v=jhjuyH4RTrM&feature=share&list=PL7EC252B253873D5D

My Analytics Story – My passion is solving problems by bringing together the best talent, cutting edge technology and tried and true methodologies. DMAIPH is all about empowering people towards better Decision-Making through the use Analytics and business Intelligence. This is what I do best. Contact DMAIPH now at analytics@dmaiph.com or connect with me directly for a free consultation about getting more analytics into your career and your business.