Outsourcing Tip > Size the Opportunity! Not to be confused with Seizing the Opportunity.

When you have an opportunity to get involved with outsourcing, it always sounds like a good way to make some fast money.

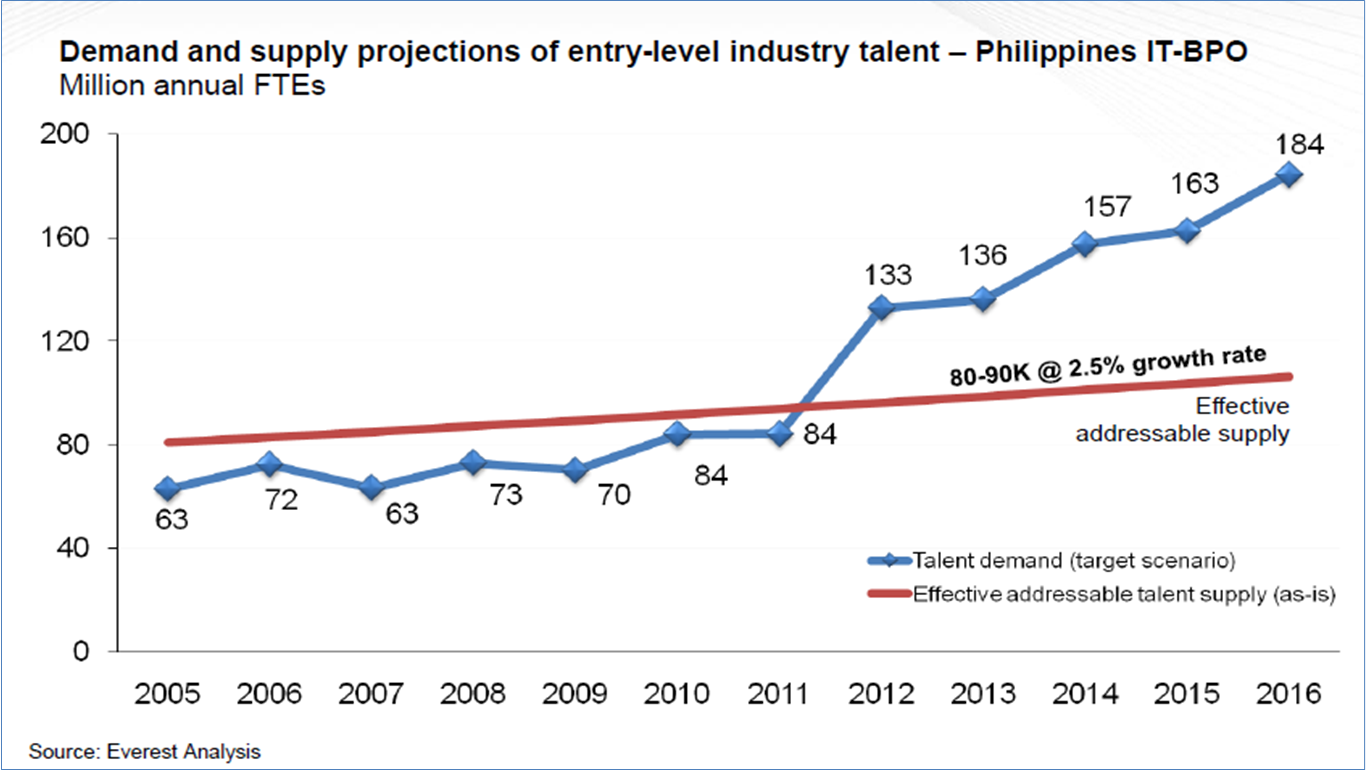
The news has been abuzz for a while now with mounds of data and statistics about the high-speed growth in the outsourcing industry, especially here in the Philippines. Just yesterday I saw a projection that BPOs in the Philippines are expecting to see a 15% growth in revenues in 2014.

Picture1

You couple that with the fact that everyone here knows someone who is making good money as a call center agent or investing in real estate that will be used by call centers, or have a friend in the US who knows someone who wants to save money by outsourcing. It’s one of those everyone is doing it, so why can’t I kinds of things.

This is all good, but there are just as many failures as there are success stories when it comes to small and medium-sized BPOs. Ones where someone had a client, or a building, or an idea but didn’t size it right and misjudged on cost, or talent or market and had to close their doors and lost money.

So when you have an outsourcing opportunity in front of you, whether it be as provider or a client, make sure you size it right. Here are a few things to think about:

  1. Does the client already have an existing business that they want to outsource? If so, fully understand all the requirements of that job as it is currently performed.
  2. Can you find the talent in the Philippines to provide just as good if not a little better service as currently is being provided? A common mistake is thinking that cutting both cost and the level of service will be a win-win.
  3. How scalable is this project? How can both ends be managed in a way that allows for uninterrupted growth? Often things start easy when it’s a pilot, but once you get into production a host of issues can pop up to derail growth and ultimately the partnership.
  4. How stable is the client? Are they a startup that has a great idea and is underfunded? Those are plentiful. Or are they an established business with a strategic plan that includes the fortitude to successfully outsource a key piece of its business? These are hard to find.

That is just a few things that come to mind when I think about sizing the opportunity. Having set up 5 teams in the past year to provide outsourcing services, I have learned a lot about making sure I get the sizing done right. Keeping a client happy is all about under promising and then over delivering when it comes to time, talent and cost.

Analytics Outsourcing – DMAIPH has successful set up Filipino analytics teams for over a dozen U.S. based businesses. Offering both virtual and office based teams that specialize in problem solving using data, new technology and analytics techniques is our strength. Finding and empowering analytics talent is increasingly challenging, but we have it down to a science. Contact DMAIPH now at analytics@dmaiph.com or connect with me directly to learn more about how to set up an analytics-centric team in the Philippines.

Guest Blog: How Does HR Use Social Media? (Infographic)

http://www.socialtalent.co/blog/how-does-hr-use-social-media-infographic

Home » Blog » How Does HR Use Social Media? (Infographic)

How Does HR Use Social Media? (Infographic)

social-media-2013-survey

Posted by Siofra Pratt, December 19th 2013

Over the past year we’ve heard all about how recruiters use social media to bolster their sourcing efforts, now it’s HR’s turn! – See more at: http://www.socialtalent.co/blog/how-does-hr-use-social-media-infographic#sthash.XybotY5m.dpuf

Analyzing Social Media Campaigns

I have been working on a project for six week now and have enough data to do some analysis. The campaign is a social media one where a client asked me to help connect her company with more potential clients. Given budget and time constraints, my suggestion was to use LinkedIn to market her services to a wide audience of potential referrers, partners and clients.

I’m using a methodology I learned a while back with Wells Fargo>
1. Plan
2. Execute
3. Measure
4. Analyze
5. Optimize

social media1

The client came back with some goals, which at the time seemed reasonable. Connect with 50 potential clients a week, of which we should be able to convert 3 or so to active leads. This was going to be a 10 hour a week commitment on my part.

So I built a LinkedIn ID and started networking. I created a new one as opposed to using my existing one as I didn’t want to confuse my connections to think I was now working for a different company. I didn’t have a lot of predicting if evidence that this strategy, our goals or the process were sound… they just made sense.

After six weeks I can see where we have misfired in a couple of places. Early on it became clear that getting connected with actual people who would be clients would be a challenge because (1) they are in a different industry than most of my natural connections and (2) there is not a high % of these people on LinkedIn. So I focused more on referrals early on and it got some good buzz going but no hot leads.

Two weeks in I started switching connecting with more existing businesses who do similar things so the we could look for partnerships. This actually lead to a lot of discussion among some LinkedIn groups and several email conversations, but again no real deals in the works.

The past two weeks I have now switched tactics again to hone in on potential clients. After four weeks of building up my network, I have a number of practitioners who might be clients, but I am finding our offer a hard sell. What we offer is not something that is an easy sell by any means and trying to drum up business via an e-mail to a new connection on LinkedIn in akin to needle hunting in hay stacks.

So with two weeks left in the campaign, I am going to modify my tactics again to mainly revisit old leads and trying to re-engage ones that didn’t go hot right away but still have potential.

In the end I will have half of what I promised I would deliver… 200 new connections who know about the company and our product and have the potential to refer, partner or buy. But the other half of the goal… 24 new hot leads that ideally would lead to a few buyers still looks elusive.

Any thoughts or suggestions?

Analytics and Process Improvement

Had an interesting text conversation yesterday that I thought worth sharing as it brings up a good question… can you have process improvement without analytics?

I got a text randomly yesterday from a friend who is considering a new job as an analyst for a hospital.

flow

Friend: Hi Dan, I got a question on analytics. If I wanted to increase the utilization of rooms in a hospital, what kind of data should I be looking at?

Me: Do you want a well thought out plan or a quick and dirty answer?

Friend: I suppose quick and dirty.

Me: Length of patient stay. % of special needs patients. Physical dimensions of space to see if space is optimized. Understanding of patient process flow to see where wasted time is. Then put it all together to come up with some current metrics and then track against optimal case metrics.

Friend: What exactly do I need to be looking for if I go look at length of stay? What are optimal case metrics?

Me: To optimize usage, you need to gather data for key metrics as they currently are. And then project the same metrics is everything was working at its most efficient state. Length of stay is a key metric as you need to determine what is causing longer than expected patient stays. This will help you minimalism things causing wasted time. Analytics will identify waste and then you use metrics reporting to manage the waste. Make sense? This sounds like as much a process improvement project as it does analyst work doing some new metrics reporting. It could be a very interesting project with both short-term consulting on the process improvement and long-term need for an analyst to monitor the data via metrics reporting.

Friend: Yeah, you are making lots of sense. So, if I were trying to shorten length of stay, I would look at current length of stay per case. Then look for all the factors impacting length of stay, and then improve the process flow for the ones where its taking too long.

Dan: Something like this is how I would start.

Based on my experience, when you are presented with a business problem and asked to help solve it. It’s almost always an issue of a process that is inefficient or wasteful that is the root cause, but you need plenty of data to identify that. A good analyst is just as much a process improvement guru as they are a reporting expert.

IMG_6912

Analytics Consulting – As a founding member of Gloabl Chamber Manila, DMAIPH specializes in a variety of analytics consulting solutions designed to empower analysts, managers and leaders with the tools needed for more data-driven decision-making.

We have helped dozens of companies in both the U.S. and the Philippines, get more analytics in their business.

Contact DMAIPH now at analytics@dmaiph.com or connect with me directly so we can tailor an analytics solution made just for your unique requirements.

How I Use Logic As An Analyst

Here is a follow up to the student I am helping with her class assignment on Logic… She asked me how I apply logic as an analyst with an example and here is what I came up with.

How I Use Logic As An Analyst

According to Webster’s Dictionary, logic is “the science or art of exact reasoning” and analyst is “someone who is skilled at analyzing data”. The two definitions are where I start when how I think back to the application of logic during my career as an analyst.

To solve business problems you need data. You need to identify the right data, analyze it and communicate your results. In all three aspects of analysis work you need to employ logic.

Basil Rathbone as Sherlock Holmes

When you are given a business problem to solve, say how to determine a market for a new project or trying to figure the cause behind a slowdown in production, you need to start with data. What data you get, how you get it and where you get it from is all driven by a combination of your business experience and logic.

Logic helps you eliminate data that useful to the problem at hand. One time when I was looking for data on current remittance flows to China, a logic driven approach would be to start looking at Chinese economic websites. Which I did using the science of logic.

Once I got some data sources on remittances from the US to China, I then used logic in my analysis. Is the data current? Is the source reliable? Is it relevant? Logic dictated that I not use sources that were more than a year old, where not from government sources and where directly providing data on remittances to China.

In my analysis I saw several patterns, most remittances where going to only two provinces. That is logical when you research to see that most immigrants to the US come from these two provinces.

And when I was ready to communicate my results, my choice on which application to use, what tone to use in my language and what visuals to use were all driven by my knowledge of the audience.

Since this was for a senior manager, well-versed in remittance patterns and very comfortable with big data speak, I just cut and past some charts from Excel into an e-mail and gave him 2-3 bullet points about the patterns I saw and noted my source. It was logical that he didn’t need a lot of explanation or easy to see analysis given his pedigree.

If this had been for a more general audience of say fresh grads who have never looked at this kind of data before, it would be logical to use PowerPoint, supply several descriptive notations and some easy to digest visuals that show remittance trends.

Trying to provide students with a report designed for senior managers is illogical for someone like myself with a lot of business analysis experience.

In the end, it is my opinion that few career paths call for a more consistent application of logic then does that of an analyst.

Analytics Leadership – DMAIPH specializes in arming the Data-Driven Leader with the tools and techniques they need to build and empower an analytics centric organization. Analytics leadership requires a mastery of not just analytics skill, but also of nurturing an analytics culture. We have guided thousands of Filipino professionals to become better analytics leaders. Contact DMAIPH now at analytics@dmaiph.com or connect with me directly to discuss a uniquely tailored strategy to ensure you are the top of your game when it comes to Analytics Leadership.

An Inside Look At Analytics In Action > U.S. Census Data

US CensusIf you are working with American clients or customers, one of the most useful tools any analyst can master is the U.S. Census Data. http://www.census.gov

It is #1 source for current population data and the latest Economic Indicators and is culled from the nationwide census conducted in the US every ten years. The last collection was in 2010. However, the US Census Bureau also collects data from smaller sample sizes every year.

When I was with Wells Fargo, I used census data extensively to help us understand the demographics of targeted markets. I have also used data from the site for building competitive profiles for BPO Elite and DMAI clients.

When you go to the site (www.census.gov), it can be a little overwhelming due to the massive amount of data collected and made available. There are some videos, webinars, in class trainings and lots of learning tools available to master how to make the best use of the data.

For now though, lets focus on one particular demographic data point that I will explain how to find and use. I have a client who wants to know % of households in certain Zip Codes around the Dallas, Texas are that have at least one person over 65-year-old in that household.

Step One is knowing where to go. In this case, we will choose the data menu and then American Fact Finder. As you can see if you view the site… the choices can be quite intimidating to those not used to this site. Type in Dallas County, Texas and you will get access to all kinds of demographic data. In this case we will look at the 2010 US Census. You can see that 8.8% of the population is 65 and over.

For the sake of this blog I wont bore you with details, but then we take that data and we look at it at the zip code level. And then we can see what parts of Dallas County are “older” than others. This will help out client target his marketing efforts since his product is geared towards customers 65+

So if you have a business where you need demographic data for the US, this is the place to go. DMAI is happy to help you find ways to unlock this incredible source of data and empower your business with more analytics intelligence!

Is Analytics more an art or is it more a science? 2 of 3

gapminder-data-visualization-psfk1 - CopyRecently, a friend of mine replied to a post asking me for more details about how I would analyze and mitigate risk in a business…. “the details are a little thin. As a former professor of business decision science, I would like to read more about the model building tools and techniques of how you do it.”

My reply was “That’s a great question Chris. As a blogger I try to not go into too much detail in these posts as most of my audience is relatively unfamiliar with concepts like Big Data, Business Intelligence Applications and Predictive Analytics. That said, I can think of a couple of ways to reply to your comment. I often say that Analytics is as much an art as it is a science. So, I will craft two blog response one for the artists and one for the scientists.” And then I will conclude with my own unique approach to analytics.

So yesterday we covered the science side, today lets look at the art side. They say a picture is worth 1000 words, well I agree and would take things further and say a good pie chart is worth 10000 rows of data. 🙂

Analytics as an art form is a more appealing to the average person, because most people don’t like math. They are afraid of having to use excel and rows and rows of data confuses them. This is why we have analytics, so people who do like math, numbers and excel can figure things out for the majority who don’t.

One of the big buzzwords going around right now is storytelling. Businesses need to engage customers in the way people are engaged by a good story. Marketing team are charged with connecting with an audience in the same way a great film maker or author does. And to do this, marketers have to be very good at getting their data and analytics to a point where it can tell that story.

Data visualization is one of the most powerful skills an analyst can use. Whether it be by using charts and graphs in excel, an info graphic or a business intelligence tool like Tableau that creates data visualizations; analysts can now be artists as much as scientists.

So what does this have to do with my friend Chris’s question about business decision science. It used to be that most decision were made after a long process of drafting requirements for the IT team, a long development cycle and static reporting put into place. However, that’s old school. Now good leaders and decision-makers access data themselves and do a lot of their analysis by playing around with the data.

Knowing what data to pull, how to analyze it for patterns and trends and putting into a format where it can be used by decision makers is still the same, what’s different if the ability to get it to tell a story to the audience. My all time favorite master of data visualization is Dr. Hans Rosling, If you don’t know who he is, check out his site http://www.gapminder.org

Watching him in action is the best way to see why I think that analytics is more of an art then a science. You can have all the data in the world, and you can have great analytics talent working with it using cutting edge technology. But if you can’t use that data to influence your audience in powerful ways, then you are missing the boat.

Sharing a friend’s article – The War for Talent Rages in SE Asia!

http://www.sunstar.com.ph/cebu/business/2013/08/27/toral-digital-recruitment-insights-300020

My friend Janette recently wrote, “THE war for talent is real. Companies need to start treating people they recruit similar to responding to customer inquiries or complaints online. The slowness in responding to applicants can be the difference between hiring a highly qualified applicant now or taking only what is left in the market.”

This is one of the points I emphasize in my Recruitment Analytics trainings classes. There are so many ways that a good recruiter can make a difference, but I think the most important is engaging their candidates in a timely manner. If you work with good recruiters, you see that they manage their candidate pipelines very well… they never let them feel like they are in the dark and the recruiters create an atmosphere of approachability.

In short they follow-up often. And the digital world allows us to do this so much easier than ever before.

Janette adds, “Companies should level up and embrace digital at the same level as marketing uses it to reach out to prospects and customers.” They can do this by using the following tools:
> Use websites as a tool not only to attract customers but also prospective employees.
> Use social networking tools to build their digital influence and make themselves accessible online.
> Foster an open communication culture using the various modes of communication we have available.

As one of my best friends and colleagues at BPO Elite, Rachelle explains to me… in the end the most important thing is to find the right person for the right position. To do this you will see good recruiters embracing new technologies and take full advantage of the digital resources available to them.

And of course the best thing about using these digital resources is that they are chock full of analytics. LinkedIn, Bullhorn, Indeed, Facebook, Twitter, etc. all offer free analytics tools embedded in the applications that allow you to see who is seeing and following you. For a recruiter, it’s an amazingly powerful way to stay engaged with their candidates because they can see patterns and trends in who they interact with.

For more info on what Janette is up to, you can follow her at https://www.facebook.com/digientrepreneur

Big Data and Analytics: How to avoid going the way of the Dinosaur!

jurassic_parkhttp://www.linkedin.com/today/post/article/20130822181033-251829763-big-data-blurring-risk-and-uncertainty

“More than 99% of all species that have ever existed are now extinct. The causes of species extinction include the predictable — predator-prey relationships, for example — to the unpredictable, such as an asteroid collision. Similarly, 90% of Fortune 500 companies since 1955 no longer exist. Businesses, like species, face perils that range from identifiable risks to true uncertainty or unknowns. Uncertainties pose unknowable and hence unmanageable threats. Risks, however, can be explicitly accepted, avoided, or transferred. Organizations that are fully exploiting big data are actively uncovering and converting uncertainty into known risk as well as addressing and exploiting competitive vulnerabilities.”

The following three big-data analytics keys are critical to supporting a proper understanding of risk versus uncertainty — and ultimately leveraging risk for competitive advantage.

1. Healthy Analytics Culture. The first key to using big data analytics to survive is empowering business owners and leaders with the ability to use data to drive decision-making. There is so much data to analyze, so using cutting edge analytics tools and employing curious and proactive analytical professionals help maintain a healthy culture.

2. Segmenting Risks. The second key is know how to identify and classify risk. When you come across a risk in your business you have to assign the right team or person to investigate the risk. To understand if it should be accepted, avoided or somehow transferred. Accepting risks means you have to monitor it and make sure its controllable. Avoided risks require changes in strategy or process, often needing people to lead a new way to do things. Transferring the risk means you need to trade-off things or hiring someone else to take the risk from you. Big Data analytics allow you to investigate, assess and segment risks.

3. Accept, Avoid or Transfer Risks. Once you have decided how to segment risk, then you need to take action. You need to set up a mitigation strategy, you need to monitor the risk and you be capable of re-segmenting the risk if it changes.

Businesses that can access their big data, that can analysis it and that use it to drive decision-making will survive. Ones that do not will go out of business, be acquired or just go the way of the dinosaurs.

Analytics Tool for Sales #3 – Customer Insights

143The third area that most business people undervalue in importance is gathering actionable insights from their customers. Aside from general conversations and dealing with irate or upset customers, how much knowledge are you actually gleaning from them. Do you survey them? Do you have a loyalty program? Do you do AB testing before making changes? These are just a few ways to build up data points you can use to gauge customer satisfaction, understand customer pain points and unearth new niches to exploit.

This is one of the things that Wells Fargo does exceptionally well. During my time with the bank, I was involved with a number of surveys and focus groups to give us some soft data to go with mountains of hard data we culled from internal and external sources. Far too often decisions are made without really listening to the customer… think about the misfires Nextflix had a few years ago. It could have easily been avoided with better intelligence on customer sentiment and a better understanding of what they value. Netflix antagonized their extremely loyal customer based and then made matter worse by mishandling customer feedback.

Beyond just conducting the survey, there are many sure fire ways to construct the survey to assure you get actionable data from the exercise. Just asking questions will only get you so far. You need to be able to construct the questions to give you useful answers that you can use to drive decision-making.

With free survey tools like Surveymonekey, and the ability to easily gather data online via social media, there is really no excuse for a company to have blind spots with their customer base. If you need help setting up, delivering and/or analyzing a customer survey, DMAI has extensive experience with this business intelligence tool.